INTRODUCTION
Because no standardized method of measuring “blowback” in a small arms system exists, there is a desire to develop one.
When a suppressor is added to a small arms system, it typically tends to increase the system’s back pressure. Fundamentally, back pressure is caused by a reduction in flow rate at the muzzle of the barrel due to an increase in pressure caused by the suppressor. A suppressor traps high-pressure gas and blocks the flow from the barrel’s muzzle. After the flow starts to settle down in the suppressor, a more constant flow field is established. At this point, the suppressor acts more like a plenum attached to the muzzle, allowing the gas pressure to decrease much more slowly as it blows down. Significant pressure can still be present in the chamber when the bolt starts to open. At this point, propellant gases escape from the chamber at the same time they are exiting the muzzle. These gases are “blown back” toward the operator, thus the term “blowback.”
This article describes how electrochemical sensors are used to measure and quantify the combustion products of the blowback gases using suppressed and unsuppressed small arms systems by a “Chamber Test Method” as well as a “Breathing Zone Test Method.” In addition to gaseous combustion products, metals are also aerosolized during combustion and firing of a round and measured.
EXPERIMENTATION
Background and Methodology
Blowback gases consist of combustion products that result from the burning primer and propellant from the ammunition cartridge within the small arms system as well as metal particles aerosolized from the primer, propellant, and projectile. While the combustion products consist of a variety of gases, the three primary toxic gaseous constituents are carbon monoxide (CO), ammonia (NH3), and hydrogen cyanide (HCN).
The effects of these toxins can vary. Carbon monoxide impairs the blood’s ability to transport oxygen. Although this is typically a long-term exposure issue, it is also important for short-term exposure at high concentrations. The effects of ammonia are immediate at the onset of exposure and consist of eye, nose, and throat irritation. The ammonia constituent causes the most significant operational issues in blowback gases due to these physiological effects. Short- duration exposure to hydrogen cyanide can cause eye irritation, breathing difficulty, headache, nausea, and vomiting [1].
Metals are aerosolized from the primer and propellant as well as the projectile as it travels down the barrel and the outer layer of the projectile ablates. This can also cause short-term onset of health issues, most commonly called “metal fume fever” [2]. Metal fume fever typically results in flu-like symptoms. Some of the primary metallic toxins of interest are copper (CU), zinc (Zn), bismuth (Bi), and lead (Pb).
A two-pronged approach at measuring blowback was used. First, blowback was assessed from a “total blowback” standpoint, measuring the total gases and aerosols that are blown back out of the weapon’s chamber and operating group area. This is called the “Chamber Test Method.” Next, blowback was measured and assessed from the system level considering the directionality of the event and measuring the blowback gases that reach the operator’s breathing zone. This is called the “Breathing Zone Test Method.”
In most cases, the full system toxicity (weapon and ammunition) has previously been measured by using TOP 2-2-614, “Test Operations Procedure: Toxic Hazards Tests for Vehicles and Other Equipment” [3]. The ratio of each gaseous constituent is already known. As such, much can be gained simply from measuring the concentration of only a single gas (called an “indicator gas”) and then estimating the concentrations of other gases based on the known ratios to that indicator gas. In the case of current propellants, CO is the most prevalent toxic gas, is the easiest to measure, and is a good choice for an indicator gas. While adding a suppressor to the system could have some small effect on the combustion compared to the unsuppressed system, this effect would be negligible.
Strategic data collection through a systematically designed experiment provides a gateway to answer questions about what input variables are driving changes in the output of a system, product, or process and to establish traceability. The key advantage of using designed experiments is that the experimenter controls which combinations of inputs are explored. This allows control over which ranges to explore as well as establishes relationships between inputs and outputs. It is the direct opposite of observational data, where the user has no direct control and there is no active manipulation of inputs. Design of experiments and thorough test planning facilitates managing statistical risk in achieving test objectives and ensures test matrix balance and test execution robustness to support meaningful, valid, statistically defensible results.
Design of experiments and thorough test planning facilitates managing statistical risk in achieving test objectives and ensures test matrix balance and test execution robustness.
The test matrices for each test method were designed using design of experiments (DOE) best practices, leveraging analysis from past test data to inform the prospective power and sample size analysis, and assuming 95% statistical confidence, 80% minimum threshold for statistical power, standard deviation (root mean squared error [RMSE]) determined from within-group variations in previous analysis (peak CO = 124 ppm), factors, and factor-levels of interest (firing mode, inlet side, and configuration). A set of 32-run matrices provides approximately 80% power to detect effects equal to or greater than the within-group standard deviation (RMSE) for all main effects and two-factor interactions, 98.3% power to detect effects equal to or greater than 1.5 x RMSE, and 99.97% power to detect effects equal to or greater than 2 x RMSE for all main effects and two-factor interactions (at 95% statistical confidence).
Randomization, replication, and blocking are fundamental to DOE. Randomization is used to minimize the risk of nuisance variables, such as temporally correlated error sources, thus corrupting the test results. With some risk, modifications can be made to statistically “ideal,” full randomization for practical test execution reasons (as done with this test matrix). However, it is imperative that the test be run in the order specified in the test matrices rather than reordering to simplify test execution because this will result in significant reduction to test statistical power.
Chamber Test Method
The objective of the Chamber Test Method is to measure the direct effect adding a specific suppressor or muzzle device has on the amount of gases and aerosolized metals blown back toward the operator (Figure 1). The chamber method was performed by measuring the concentration of the total amount of toxic gases and the mass of filtered metallic aerosols blown backward into a chamber of known size with the suppressor or muzzle device in question installed. A handheld gas analyzer was used for all gas measurements [4]. Metals were collected by passing air from the chamber through an Isopore membrane filter with a 0.4-µm pore size produced by Millipore (HTTP type). The filter used a three-piece, 37-mm cassette, with the end cap remover to allow the whole filter face to be exposed to the gas inside the chamber. The air was pulled through the filter at a flow rate of 2 liters per minute by an AirChek XR5000 pump from SKC. The sampling time was 3 min. Thus, the total amount of air that passed through the filter was 6 liters.
![Figure 1: Chamber With Weapon Muzzle Inside (Total Propellant Gas, Top) and Muzzle Outside (Blowback Gas Only, Bottom) (Source: Norwegian Defence Research Establishment [FFI]).](/wp-content/uploads/2019/11/blowback_jacob_fig_1.png)
The chamber design follows closely with previous work in toxicity measurements [5]. Since the chamber volume and, therefore, the measured gas concentrations can vary depending on the weapon, scenario, and configuration tested, quantity of gas is reported by mass. If the number of moles present and the molecular mass of a gas are known, the mass of that gas can be calculated using Equation 1.
mgas=n×Mgas , (1)
where Mgas is the mass of the gas in grams (g), n is the number of moles, and Mgas is the molecular mass of the gas in grams per mole (g/mol).
The ideal gas law can be used to calculate the number of moles (n) of each gas using Equation 2.
(2)
where P is the pressure in pascals (Pa), Vgas is the volume of gas in cubic meters (m3), R is the ideal gas constant in joules per mole kelvin (J/mol*K), and T is the temperature in degrees kelvin (K).
Since the volume of the chamber is variable and the measured characteristic is a concentration of each gas in parts per million (PPM), the total volume of each gas can be calculated using Equation 3.
Vgas=Vchamber×Cgas , (3)
where Vchamber is the total volume of the chamber (m3) and Cgas is the concentration of the gas (PPM).
Equation 3 can then be substituted into Equation 2 to get Equation 4.
 (4)
(4)
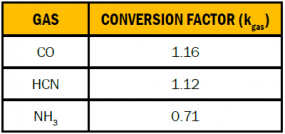
If the gas pressure is approximately atmospheric and the temperature is room temperature, conversion factors (kgas) can be calculated for each gas to calculate the mass of each gas in milligrams (mg) by using the molecular mass of each gas (see Table 1). Equation 1 can then be simplified to Equation 5 to calculate the mass of gas in milligrams.
Table 1. Conversion Factors for Mass Calculations
mgas=kgas×Cgas×Vchamber . (5)
To analyze metals, each filter was digested with 10 ml of aqua regia (mixture of HCl and HNO3) at 175 °C for 30 min in a Mars 6 microwave instrument from CEM. After digestion, the sample was transferred to a 100-ml bottle and diluted to 100 ml with ultrapure water. The diluted sample was analyzed by inductively coupled plasma-sector focusing mass spectrometry, inductively coupled plasma-atom emission spectroscopy, and atomic fluorescence spectroscopy at ALS Scandinavia AB in Luleå, Sweden. The following elements were analyzed: Fe, As, Ba, Cd, Cr, Cu, Hg, Mn, Ni, Pb, Zn, Sn, Sr, Bi, Sb, Ti, Co K, Mg, Na, Al, Ca, Mo, and V.
Breathing Zone Test Method
The objective of the Breathing Zone Test Method is to assess blowback from a system level by measuring concentrations of toxic gases in the location of the weapon system operator’s breathing zone during firing with a suppressor, muzzle device, or other accessory of interest. Metals were not filtered or analyzed during this test method.
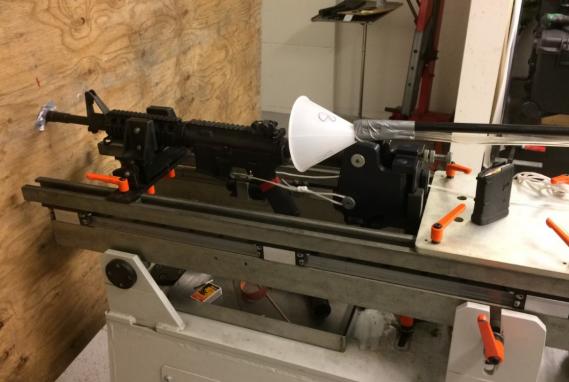
Testing was performed in an indoor range. A 4- by 8-ft sheet of plywood was used as a blast wall between the muzzle and the rest of the weapon, including the gas block. The weapon was hard mounted with its muzzle placed through the center of the blast wall. This prevented muzzle gases from mixing with blowback gases during measurement and ensured that the environment was free of airflow, wind, and obstructions during data collection. A 4-inch air inlet funnel was affixed at the location of the operator’s breathing zone, as measured from an approximate 50% operator shouldering the subject weapon system. Testing accounted for left- and right-handed operators, per Figure 2.
RESULTS AND DISCUSSION
Chamber Test Method
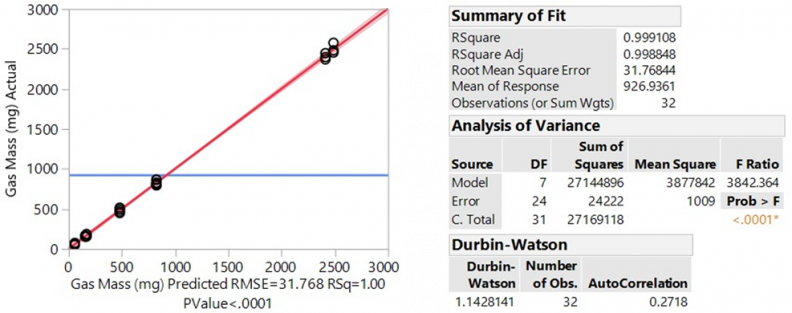
The results from the Chamber Test Method showed consistent and repeatable results. Using Equations 1 through 5, quantities are reported in milligrams of gas. Figure 3 shows each data point (shown as points) as well as the mean for each configuration tracked by the blue tracking line. Figure 4 shows the analysis of variance (ANOVA).
![Figure 3: Mass of CO Produced – All Shots (Source: U.S. Army Armament Research, Development and Engineering Center [ARDEC].](/wp-content/uploads/2019/11/dsiacjournal_winter2019_blowback_jacob_fig3-685x367.jpg)
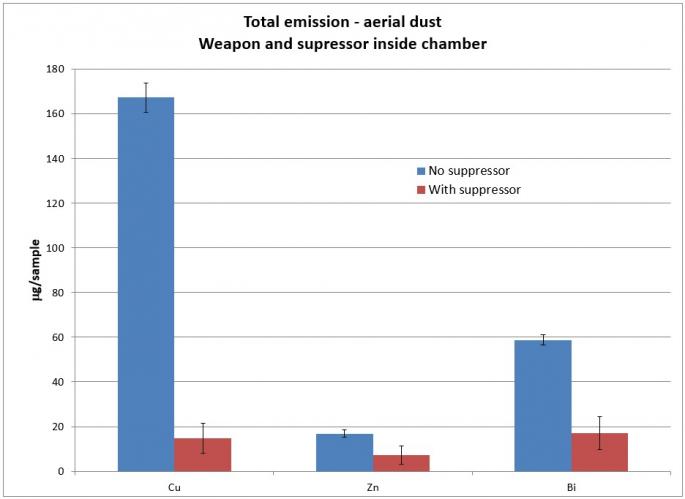
The primary metallic aerosols measured were Cu, Zn, and Bi. Pb was not measured because lead-free ammunition was used for the test. However, lead would also be of interest in ammunition with lead content in the primer, propellant, or projectile. Results of metallic aerosol measurements for the muzzle inside and outside the chamber, respectively, are shown in Figures 5 and 6.
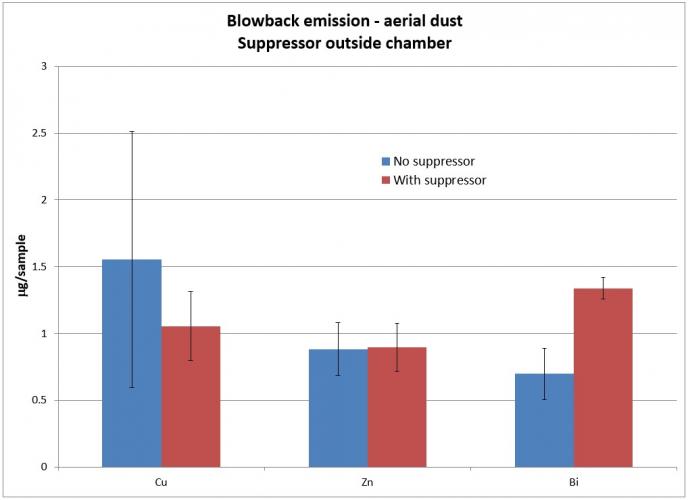
Note that there is an overall reduction of Cu, Zn, and Bi from the full weapon when a suppressor is added. This indicates that these metals are, to some extent, deposited inside the suppressor when a suppressor is installed on the weapon. Cu is significantly reduced when a suppressor is added. This reflects previous testing, which showed a suppressor gaining weight after extended firing.
When the suppressor is placed outside the chamber, Cu is still reduced with a suppressor. However, Zn remains relatively unchanged, and Bi increases. This is likely because the primary source of Cu is the projectile and these particles substantially leave the muzzle during firing. In contrast, the primary source of Bi is the propellant. When the gases are blown back, the aerosolized Bi particles are then blown back as well, increasing the total amount in the blowback gas.
Breathing Zone Test Method
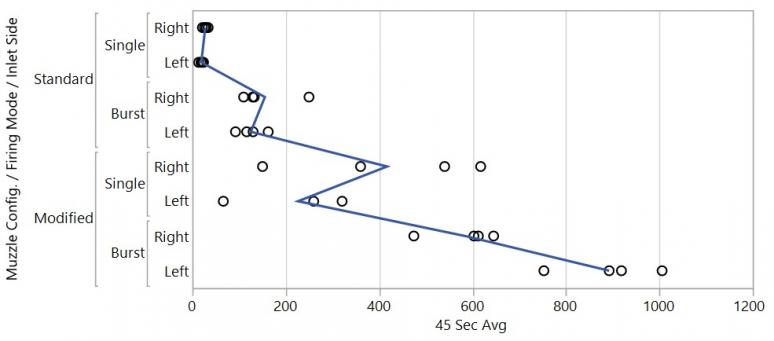
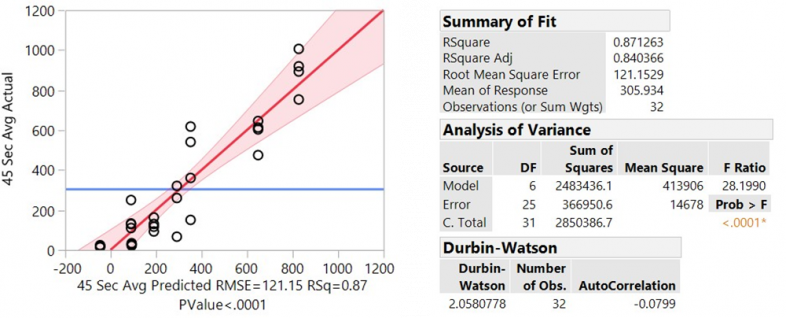
The results from the Breathing Zone Test Method were not as consistent or repeatable but showed insight and basic trends into what happens with the gas after it leaves the chamber and operating group of the weapon in a given configuration. Quantities are reported in concentration of gas in PPM and are reported in 45-s time weighted averages. Peak, 15- and 30-s time weighted averages, were also calculated but not reported here. Figure 7 shows each data point for 45-s time weighted averages (shown as points) as well as the mean for each configuration tracked by the blue tracking line. Figure 8 shows the ANOVA.
CONCLUSIONS
Adding the suppressor to the weapon system results in measurable differences of blowback gases using the methods described. While certain toxins were measured for this test, it is important to tailor the measurements to the toxins that are of interest for the assessed system.
Adding the suppressor to the weapon system results in measurable differences of blowback gases.
The Breathing Zone Test Method is less repeatable but shows different results that would not be observed with the Chamber Test Method alone. Data has shown that this method can measure differences in concentration at the operator’s face. This shows that the method can assess directionality, which plays a role in operational impact.
The Chamber Test Method measures the total blowback gases, regardless of directionality after they leave the chamber and operating group. Since chambers of different sizes can be used to account for potentially different sized weapons or different amounts of gases produced, Chamber Test Method results should always be reported in mass of gas to eliminate the effect of the chamber volume on the results. This allows appropriate comparison of results between different chambers, regardless of size. The Chamber Test Method, in contrast to the Breathing Zone Method, is very repeatable and consistent but does not consider the system-level effects, such as other changes to the weapon system to redirect the gas. This indicates that neither method alone is sufficient to assess the true operational impact of the blowback gas and the best assessment is the combination of both methods.
The metallic dust filtering showed that, in general, metals aerosolized from the projectile are largely deposited within the suppressor. Metals aerosolized from the primer and propellant constituents tend to blow back proportionally with the rest of the blowback gases in the system.
Finally, it is important to consider that the order of testing is critical to randomize error. The order of testing was developed through DOE methods, with the intent to randomize error within the test. The important consideration is that one cannot simply test all of one configuration and setup, then switch to next, and so on. Even if that is easier or quicker, it could result in potential systematic error that must be randomized.
References:
- Center for Disease Control and Prevention. https://www.cdc.gov/niosh/ershdb/emergencyresponsecard_29750038.html, accessed 4 May 2018.
- Greenberg, M. I., and D. Vearrier. Metal Fume Fever and Polymer Fume Fever. Clin. Toxicol. 2015, vol. 53, https://www.tandfonline.com/doi/full/10.3109/1556365 0.2015.1013548, accessed 30 May 2018.
- U.S. Army Test and Evaluation Command. Toxic Hazard Tests for Vehicles and Other Equipment. TOP 2-2-614, U.S. Army Combat Systems Test Activity; Weapon Systems Tests, Aberdeen Proving Ground, MD, 1995.
- Drager X-AM 5000 Multi-Gas Detector. https://www. draeger.com/Products/Content/x-am-5000-pi-9046318-en.pdf, accessed 4 May 2018.
- Dullum, O., A. Johnsen, and L. Sundem-Eriksen. Emission of Gas and Dust From Small Arms. Report no. 2015/01728, Norwegian Defence Research Establishment (FFI), Norway, October 2015.


