


INTRODUCTION
Hydrodynamic ram (HRAM) occurs when a fluid-filled enclosure is penetrated with a high-velocity projectile. A classic case, and common occurrence, is when an aircraft with fuel in the wings is impacted with a fast-moving projectile, which could be foreign object debris or a ballistic projectile. The projectile will, in turn, transfer its energy to the fluid, creating a very high pressure, which is then imparted onto the structure. The pressure is very high near the projectile, on the order of 10 ksi [1], and decreases exponentially away from the projectile but may still carry enough energy to cause catastrophic damage. The structural damage can range from complete structural failure to damage of critical internal components. There is also damage at the projectile entry and sometimes exit locations. The nature of this damage will vary based on the nature of the material (e.g., whether it is metallic or composite). HRAM occurs in four distant phases, with each phase accompanied by its own pressure distribution [1]. The phases are shock, drag, cavitation, and exit [1].
The shock phase describes the introduction of the projectile into the medium. The structure and fluid will be impulsively-loaded upon impact, creating a hemispherical shock wave in the fluid that travels at the speed of sound. The effect of this shock is dispersive and encountered by most of the structure in its path and cone of the wave. Depending on the scenario, this phase may exhibit the highest pressure.
The next phase is the drag phase. During this phase, the stagnation pressure generated from the projectile slows it down in the fluid, transferring its energy to the fluid. The pressure generated in this stage tends to be lower than in the shock phase.
The most complicated stage, known as cavitation, occurs next. At this stage, the projectile creates a cavity behind it by violently moving the fluid, creating a low-pressure region, which causes some of the fluid to vaporize or cavitate to establish equilibrium. A combination of high pressure and gravity causes the cavity to collapse, which sends a strong pressure pulse through the fluid and to the structure. This will usually result in oscillations with subsequent smaller pressure pulses.
The final stage is the exit stage. This stage is similar to impact damage when the projectile first hits the projectile except the wall at the exit is prestressed from the previous stage, which will magnify the damage. Based on the composition of the material and projectile characteristic, the critical damage from HRAM will focus around the projectile exit and/or the joints of the enclosure.
During aircraft design, the effect of HRAM must be accounted, usually through testing, to ensure that catastrophic damage does not result from an HRAM event (or damage from HRAM is manageable) [2]. To achieve this, two main tests methods are utilized. In one method, joints are isolated and tested to understand their HRAM resistance using a RamGun or universal testing machine. The other method is a complete test of the article of interest to an HRAM event. This is very effective, albeit expensive, which tends to limit the amount of testing that can be conducted.
Numerical methods have been used to understand and complement HRAM testing. This provides a cost-effective method for studying the event and reducing the testing scope. Numerical methods for HRAM analysis started from using the piston theory and went through iterations where the continuum equations were finally incorporated. The current state of the art is combining an algorithm that can account for the drastic fluid movement without distortions and, at the same time, account for deformation of the structure [1]. The leading methods are arbitrary Lagrangian-Euler (ALE) and smooth particle hydrodynamics (SPH). Both methods have shown promise and are used by several researchers to study the event. While SPH tends to have more resolution, ALE seems to be the better option for larger articles [1].
A continuing trend in the aerospace industry is the increasing usage of composites, from about 1% in the 1960s to over 50% by weight currently, and with even higher percentages projected in the future [3]. As the industry builds confidence in composites, their use has transitioned to structural parts like the wings.
A recent trend accompanying composites is bonding structural composites instead of fastening them. This approach eliminates weight and bearing failure [4]. It also produces a better stress distribution around fasteners that is favorable for composites. Various analytical techniques are used to study bonded joints, including those developed by Hart-Smith and the Volkersen method. These methods can limit utility for analyzing complex structures and loading that would be experienced in a primary structure. Hence, finite-element analysis is used to assess bonded joints for primary structure, with cohesive zone modeling (CZM) at the forefront. CZM is a fracture mechanics technique that can track crack initiation and growth using an idealized representation of joint failure in terms of disbond and delamination [5, 6]. With the current trajectory of the aerospace industry, it is imperative to understand the effect of HRAM on bonded-composite fuel tanks. This research aims to study HRAM in bonded composites and propose a numerical method to accurately assess damage. This approach will potentially save money on costly testing and provide insight into aircraft vulnerability early in the design process. The proposed method will combine ALE fluid-structure interaction (FSI) and CZM in LS-DNYA to predict damage using a building block approach.
ANALYSIS APPROACH
Penetration damage at the inlet and exit of a fuel tank can be modeled numerically with relative ease [1, 6]. The biggest challenge is damage prediction at the seams or joints of the fuel tank. Joint damage from HRAM is one of the critical modes of failure for both fastened and bonded structures; it can be even more catastrophic in bonded joints due to the threat of continuous delamination and disbond. A building block approach is used to build the numerical model for assessing tank damage in a bonded composite tank. The building block in Figure 1 is based on damage characterization at the joint level by using a local breakout model conducive for calibrating joint CZM properties. The calibrated model is then verified in a full-scale RamGun model [7]. Finally, the joint model is extrapolated to the complete fuel tank model.
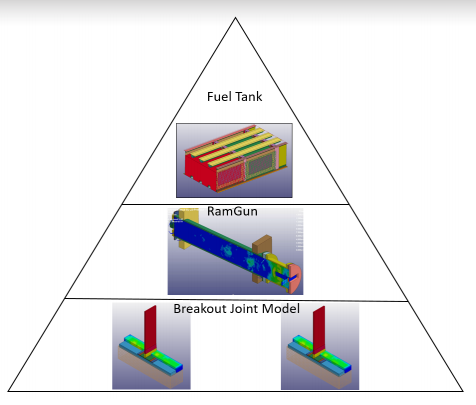
Figure 1: Building Block Approach Used for Numerical Model (Source: Northrup Grumman Corporation [NGC]).
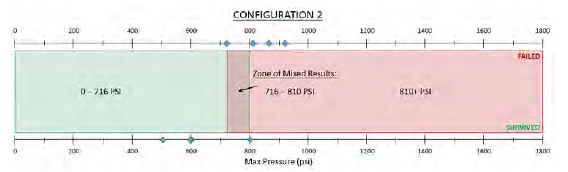
Figure 2: Sample Pressure Spectrum Showing Failure, Nonfailure, and Region of Mixed Results (Source: NGC).
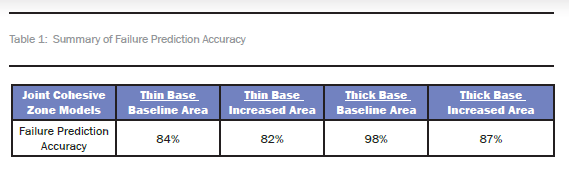
Based on the RamGun results, previous research showed that increasing the base thickness of a joint tends to increase its strength and, hence, HRAM resistance [9]. More significant is the effect of increasing the total bonded area [9]. Increasing the bonded area to about 40% by adding extra plies at the interface of the Pi preform and the base resulted in an increase of about 70% in bond strength [4]. In a previous study, the joint numerical model, when calibrated to empirical failure data, was able to accurately predict joint failure across a range of pressures [7]. The greatest disagreements between the model and the experiments were RamGun pressures in the inflexion region (see Figure 2), where there is also the greatest uncertainty in the experimental results. Table 1 shows the summary of the numerical failure prediction results.
In this research, the calibrated CZM joint model was transposed to the complete tank model, as shown in Figure 3. The joint in the tank numerical model was modeled with the appropriate CZM parameters and joint area based on the desired configuration. The coarse mesh model of the joint enables the fuel tank, which is a large structure, to be modeled and used to accurately predict progressive damage in the tank.
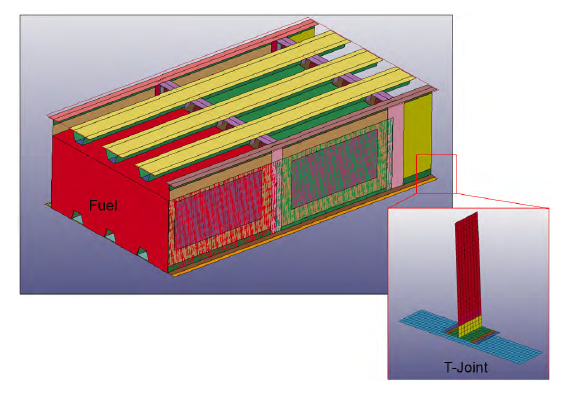
Figure 3: Extrapolating Joint Failure to Fuel Tank Failure (Source: NGC).
MODEL AND SIMULATION
A finite-element model of a representative fuel tank is modeled in LS-DYNA to predict failure of a bonded composite fuel tank subjected to HRAM caused by impacting the tank with a projectile. The critical structural connection of interest, the spar-to-skin joint, is modeled as a bonded joint representative of the T-joint tested in the RamGun. The tank FEM is divided into Lagrangian and Eulerian components. The Lagrangian components consist of the tank and the projectile. The Eulerian components consist of air and water. The model measures 92 inches x 42 inches x 30 inches and contains about 7.3 million elements.
A 150-grain cubic projectile, which weighs about 0.0214 lbf, is used in this simulation. The projectile is modeled with Lagrangian solid hexahedron elements. It is modeled as a rigid material since stress and strain data for the projectile are not essential to the simulation and its deformations are not significant at this fidelity. This technique saves on total simulation time.
The tank was modeled with hat-reinforced top and bottom skins, stiffened forward and aft spars, and three stiffened ribs resulting in two fuel bays. The bay where the projectile impacts is dubbed the primary bay. The tank components are modeled with shell elements. An average element size of 0.25 inches is used, which resulted in 311,264 elements for the Lagrangian model designed as a composite material. The main failure of interest is the joints. The same bonded joint design used in the RamGun models is implemented in the box-level analysis. A cohesive zone modeling approach is used to model the joints.
The initial projectile velocity applied to initiate the simulation did not simply match the preimpact velocity but was modified to ensure that correct conditions were obtained following initial impact. For efficiency, the tank was modelled with shell elements. These elements are unable to accurately reduce the energy of the projectile as it penetrates the wall. To accurately model the energy imparted into the system, the initial velocity is adjusted to compensate for this effect. Other researchers [1, 6] address this problem by solid elements, but that approach is prohibitive for a realistic tank due to size. To use the current approach, a study of residual velocity was conducted.
Various panels similar to the skin, with different thickness, were shot with the intended projectile. The reduction in the projectile velocity was recorded. After a sufficient sample size was obtained, the average velocity reduction was observed to be about 13% for the skin thicknesses used in this analysis. The residual velocity was calculated using this factor as input in the simulations. Contact between the projectile and the skin was ignored; the projectile just passed straight through the skin and directly impacted the fluid with the required residual velocity. This approach eliminated a step from the analysis and replaced it with empirical data while providing consistent results in projectile energy.
To ensure accurate fluid-structure interaction analysis, the mesh needs to be fine enough to transfer the energy from the projectile effectively, which will dictate the stopping distance of the projectile distance in the fluid and the resulting pressure. Some researchers use an estimate of stopping distance, based on projectile shape and density of fluid, to determine the appropriate mesh density for the analysis [11]. Others calculate the stagnation pressure or use pressure data, if available, to determine the mesh size. To accurately track the pressure, these methods usually result in mesh sizes of about 0.0625 inches. That mesh size is impractical to use for a large article like the one analyzed or for larger fuel tanks. A plan was devised to obtain accurate pressure distribution while maintaining a relatively coarse mesh to reduce the size of the overall model and hence the solution time.
A test was conducted where a 150-grain cubic projectile was shot into an instrumented tank. The tank contained pressure transducers (PTs) at different locations to capture the pressure during the event. The projectile velocity was varied to provide a variety of data. An FSI model was created similar to the one used for the fuel tanks. The projectile velocity in the numerical model was modified for each run until the pressure predicted by the numerical model matched the pressure recorded by the pressure transducers during the test. The hydrocode used in LS-DYNA is dissipative in terms of pressure, so it is difficult to match pressure far from the source. A linear relationship was developed that increased the residual velocity to make up for the coarse mesh and replicate pressure recorded by the PT in an actual experiment. A linear relationship was then applied to the numerical model for the fuel tank. Figure 4 shows the calibration process for the mesh and pressure.
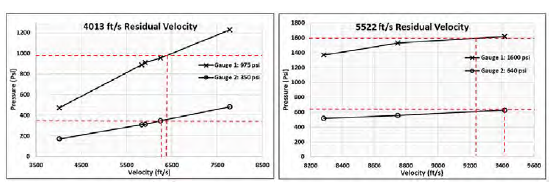
Figure 4: Velocity Calibration (Source: NGC).
Two baseline velocities were analyzed—4,013 ft/s and 5,522 ft/s. The pressure readings from near- and far-field gages—gauge 1 and gauge 2, respectively, were recorded for reference. The analysis pressure seems to have a linear relationship with velocity. It was found that the experimental velocity had to be increased by a factor of 1.6–1.8 to match the pressure data.
The main parameter used to track and assess failure capability is pressure. Pressure also provides a measure of analysis accuracy when compared with experimental results. In this research, since the box-level analysis is built up from the RamGun models, pressure from both tests provides a way to assess how well they track. This can lead to future RamGun studies to make joint-to-complete tank analysis seamless. LS-DYNA provides tracers in the ALE simulation, which act like pressure transducers.
The tracer elements are illustrated in Figure 5, where 20 tracers are used. Based on the proposed methodology, four distinct models are created to provide correlations from the RamGun models and test. The models were thin skin, thick skin, and a model with an increase in bonded area for both base thicknesses, thus resulting in four models.
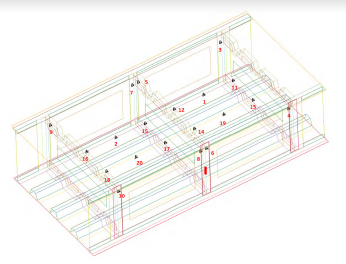
Figure 5: Number of Tracer Elements in the Model (Source: NGC).
RESULTS AND DISCUSSION
To build confidence in the numerical model and its ability to accurately predict HRAM damage in a composite fuel tank, the fluid mechanics of the HRAM event is checked to make sure it follows the HRAM evolution and conservation laws. Figures 6 and 7 show the progression of the HRAM process as captured by the numerical model.
The projectile impulsively loads the fluid and creates a high-pressure, hemispherical shock wave. This is the HRAM shock phase, which can be seen explicitly in Figure 6. The drag phase follows as the projectile slows down and transfers its energy to the fluid. The pressure has a radial shape and stays in front of the projectile and moves with it. Since the initial shock pressure moves at speed of sound in the fluid, it is faster than the drag pressure pulse and stays ahead of it. The cavitation phase is also evident, as shown in Figure 7. The cavity grows behind the projectile, and the projectile slowly comes to a standstill as it transfers all its energy to the fluid. The cavity continues to grow to its maximum size and then collapses due to the pressure difference and gravity. There was no exit stage since the fluid depth and projectile velocity ensured complete transfer of the projectile energy to the fluid before the projectile reached the wall. Therefore, it did not have any energy to exit the structure.

Figure 6: Shock Created During HRAM (Source: NGC).
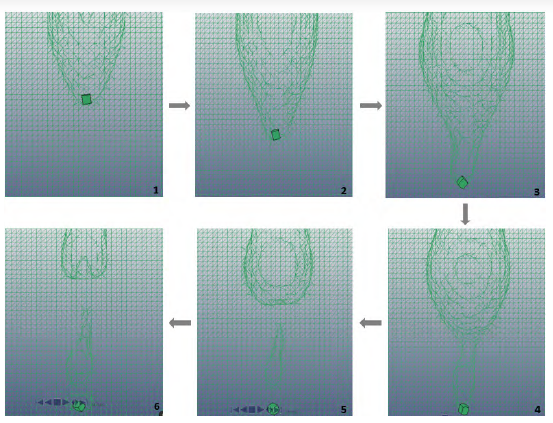
Figure 7: Cavity Evolution (Source: NGC).
The tracers were used to monitor the pressure inside the tank to provide more insight on the event. Figure 8 highlights a few tracer nodes to provide insight into the pressure distribution. The tracers closest to the projectile were about 7 inches away and recorded the highest pressure of 8.2 ksi x 0.5 ms, dissipating quickly thereafter. The highest pressure pulse recorded was during the shock phase. The drag phase also produces a high-pressure pulse soon after, as shown in tracer 19. The tracers next to the spar, about 14 inches away, pick up the pressure pulse later, depending on the impact location. These pressures are usually at least an order of magnitude lower than the pressure recorded near entry. For example, only 333 psi is recorded by tracer 6. This is testament to the fact that the shock pulse dissipates very quickly, almost exponentially. Even though the pressure pulse has reduced magnitude, it may still have enough energy to cause damage.
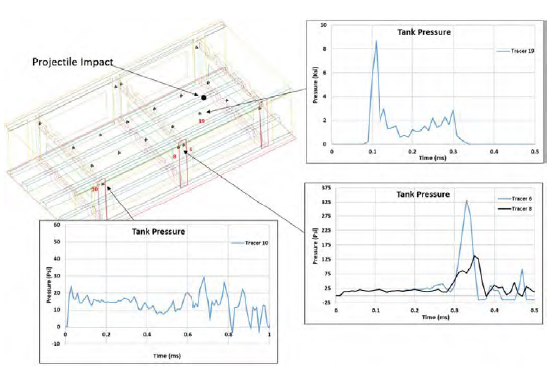
Figure 8: Recorded Tracer Pressure (Source: NGC).
There are also tracer nodes placed before (tracer 6) and after (tracer 8) the mid rib to provide information on how much the middle rib dissipates the pressure. As expected, there was significant pressure drop of about 200 psi across the rib. A model using solid elements for the skins might have yielded slightly different results for this pressure drop since solid elements better capture energy absorption and transfer. For our purposes, however, the shell element model provided an appreciable pressure drop to predict overall tank failure while still remaining computationally viable.
The tracer (tracer 10) in the secondary bay (bay without impact) recorded a very low pressure, close to ambient pressure, much later in the simulation. The damaging capacity of HRAM seems to be local but can create inertia, which propagates failure in the structure since the far-field pressure is usually not enough to cause failure.
A baseline projectile velocity of 4,000 ft/s was used in initial studies of the HRAM effect in the tank. A baseline spar distance of 13 inches (spar distance 1) from the closest spar was also used. This means the projectile is located 13 inches from the spar. Figure 9 shows the baseline impact location and an example of the HRAM cavity evolution based on impact location. The baseline impact location places the projectile over skin and avoids the hats. This was done to simplify the analysis and reduce the complexity of the event. The previously-discussed 13% reduction in velocity to correct skin penetration losses has already been determined for a projectile going through the skin (see Model and Simulation section) and is used to determine the residual velocity.
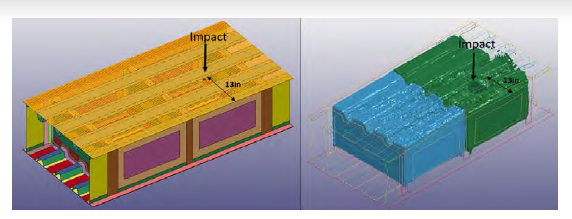
Figure 9: Nominal Impact Location and Its Effects (Source: NGC).
For different impact locations, there will be changes in the pressure distribution within the tank that determine the energy transfer and magnitude of pressure experienced within the tank. The structure will react to these pressure distributions, with deformations and possibly failure based on its composition and structural design.
The first tank assessed to determine the effects of different impact locations was based on the thin-base model. In this model, the tank skin is 0.2 inches thick. From the RamGun test, this resulted in the weakest joint, which tends to fail at a pressure range between 400 and 483 psi. At the tank level, the damage predicted for the nominal impact location was extensive. The main damage occurred at the interface between the skin and spar closest to the projectile impact. Damage propagated from the primary bay to the secondary bay, completely disbonding the whole base close to the location of impact.
The other three spar-to-skin joint locations were also severely compromised. Figure 10 shows the damage caused in the thin-base model. The image to the left shows the overall displacement of the model highlighting the disbond. The skin closest to impact had a maximum deformation of 5.68 inches. The image to the right shows the same deformation state, with the model rotated 180 degrees and hiding the skins for better interior structure visualization. The colors in the figure show the binary failure flag for the CZM surfaces. Red indicates that cohesive zone failure has occurred. It is apparent that the disbond extends all the way from the first rib to the last rib.
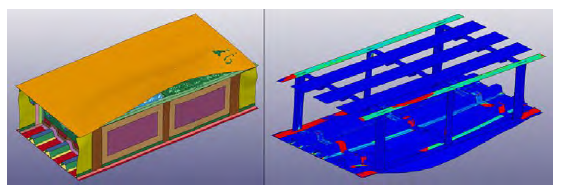
Figure 10: Thin-Base Model Predicted Damage (Source: NGC).
The thick-base tank was investigated next using the same baseline parameters. The skin thickness on this tank was 0.5 inches. The pressure experienced by the closest spar-to-skin joint was comparable to the pressure distribution that occurred in the thin-base tank mode. As illustrated in Figure 11, however, the extent of damage is very different. From the RamGun test, the thick-base model failed at a pressure range of 692–707 psi, indicating that the thick-base tank model should be able to resist more than the thin-base model.
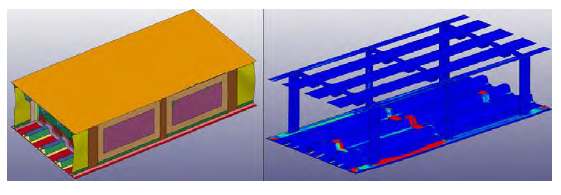
Figure 11: Thick-Base Model Predicted Damage (Source: NGC).
The displacement model to the left in Figure 11 shows a slight damage in the primary bay where the projectile made impact. The skin displayed a maximum deformation of 0.54 inches. The rotated CZM failure model to the right shows the failure/disbond more vividly. Skin-to-spar failure was contained to one bay (the primary bay), and the other skin-to-spar joints remained intact.
Parametric Study – Projectile Velocity
To understand the effect of projectile velocity on the damage, a different projectile velocity was used while maintaining the same impact location (spar distance of 13 inches). A projectile velocity of 5,000 ft/s was used on the thick-base model. Figure 12 compares the pressures generated from the 4,000-ft/s models and the 5,000-ft/s models.
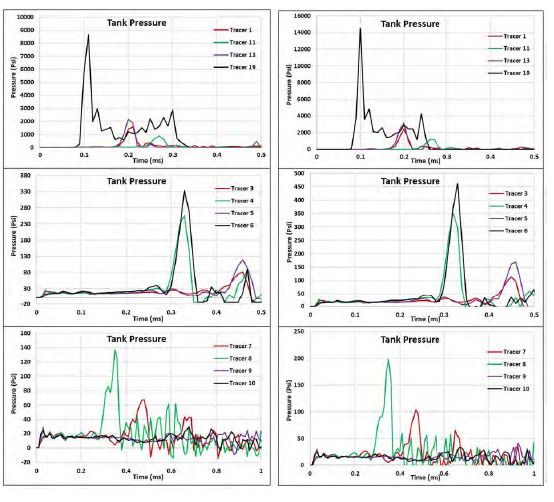
Figure 12: Tracer Pressure Distribution Comparison—(Left) 4,000 ft/s and (Right) 5,000 ft/s (Source: NGC).
For the higher-velocity projectile, the maximum pressure closest to the projectile increased by 65% to a pressure of 14.5 ksi. The pressure recorded by the tracer nodes next to the closest skin-to-spar interface increased by 40% to a pressure of 460 psi. There was also about a 40% increase in the pressure recorded by the tracers located directly behind the mid rib in the secondary bay. The farthest tracers in the secondary bay were not significantly affected by the change in projectile velocity, remaining close to ambient in each case. Irrespective of the magnitude of initial pressure, the pressure decays rapidly to ambient after a certain travel distance. The skin deformation increased to 3.15 inches from 0.54 inches for the higher-velocity projectile. The higher velocity tremendously increases the kinetic energy introduced by the projectile into the system, resulting in much higher pressure and energy. Figure 13 compares the cavity size of the 4,000- and 5,000-ft/s models. Cavity size has a direct relation to the energy introduced into the system.
Figure 13: Cavity Size Based on Projectile Velocity (Source: NGC).
Figure 14 shows the damage that occurred with the higher-velocity projectile. Because the pressure recorded at the joint location was much higher than the joint strength pressure determined with the RamGun test, it is expected that the damage state was more severe than in the simulation using the 4,000-ft/s projectile. In the high-velocity simulation, the damage was extensive and spread across both the primary and secondary bays. However the damage was contained to only the spar-to-skin joint closest to the projectile impact. The other spar-to-skin joints were intact.
Figure 14: Thick-Base Model Predicted Damage for 5,000-ft/s Projectile Velocity (Source: NGC).
Parametric Study – Distance to Spar
Another variable was assessed to study its effect on tank damage—the location of the projectile impact. Changing the impact location changes the pressure distribution and cavity formation within the tank. The projectile impact-to-spar distance changed from 13 inches to 3 inches (spar distance 2), which brought the projectile closer to the spar/skin interface that experienced the most damage in previous simulations. A 0.5-inch skin thickness was maintained for this model, corresponding to the thick-base model used in the RamGun model. Based on the RamGun test and simulation, the failure pressure for this joint configuration was estimated to be in the 692–707 psi range. Figure 15 shows the new projectile location and increased proximity of the formed cavity to the spar and skin.
Figure 15: Alternate Impact Location and Its Effects on Cavity Formation (Source: NGC).
Due to the proximity of the projectile impact location to the spar, the high pressure from the projectile will not be significantly dissipated before it is experienced by the spar. The magnitude of the pressure recorded close to the spar was as high as 500 psi, which is about 50% higher than the pressure recorded for the original spar location. The high pressure resulted in the damage state displayed in Figure 16.
Figure 16: Thick-Base Model Predicted Damage for Spar Location 2 (Source: NGC).
The displacement image showed in the left of Figure 16 reveals a maximum skin displacement of 1.7 inches. Visually, it looks like the damage extended into the secondary bay, completely disbonding both bays. The CZM failure image to the right confirms this. There also seems to be significant damage to the joint located at opposite skin in the primary bay. The other skin-to-spar joints seem to be intact, further demonstrating the local nature of the damage and dissipation of the pressure pulse with distance.
Effect of Total Bonded Area
During the RamGun joint studies, it was found that increasing the total bonded area of a joint drastically increased the joint strength. (Similar results were also shown by previous researchers [12].) Both thin- and thick-base models were analyzed, which yielded failure pressure increases of 73% and 79%, respectively. This concept was investigated at the tank level for both thin- and thick-base configurations to determine whether the trend carries over to the fuel tank since this is a promising method for reducing the extent of disbond and damage in a bonded fuel tank. The baseline velocity of 4,000 ft/s and projectile spar distance of 13 inches (spar distance 1) was maintained to produce approximately the same pressure distribution as previous models. The damage found in the augmented thin-base model is displayed in Figure 17. From the RamGun model and test, the failure pressure for this model was in the 716–810 psi range compared to 400–483 psi for the model without the bonded area extension.
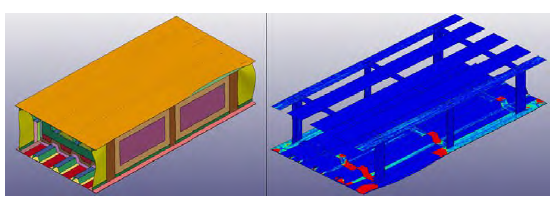
Figure 17: Thin-Base Model With Extended, Bonded Area Predicted Damage (Source: NGC).
From the displacement image in the left of Figure 17, the maximum skin deformation was about 1.8 inches. The damage seemed to be contained to only the primary bay. The CZM failure image in the right agrees with this failure assessment. Damage was reduced drastically from the original joint configuration, which showed a complete disbond of both bays with other joints also being potentially compromised.
The effect of the increased, bonded area was also checked with the thick-base model. According to the RamGun test, the failure pressure range increased from 692 to 707 psi to 1,212 to 1,292 psi. Figure 18 shows the damage experienced by the thick-base model with the increased, bonded area.
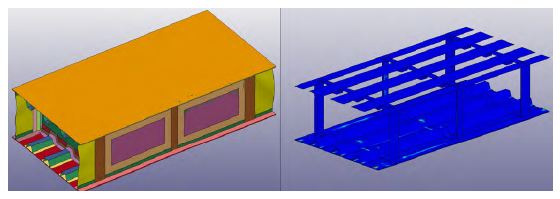
Figure 18: Thick-Base Model With Extended, Bonded Area Predicted Damage (Source: NGC).
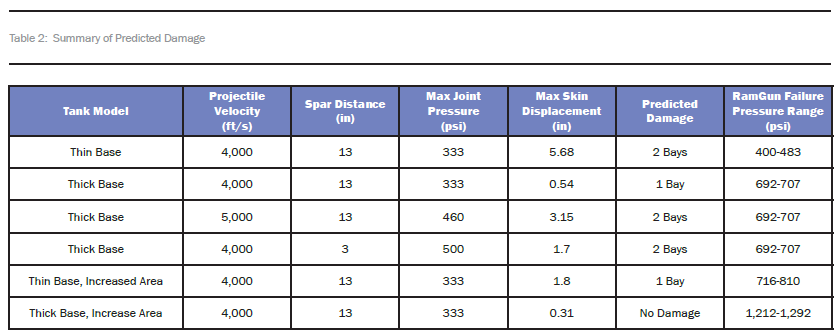
The maximum skin displacement, seen in the left of Figure 18, reduced to 0.31 inches. The displacement model shows no apparent damage. The CZM model in the right confirms this observation; no binary failure is indicated. This is a great improvement from the baseline model, which had a complete disbond in the primary bay. Table 2 summarizes the predicted damage for the different configurations and variations.
CONCLUSIONS
HRAM damage remains a critical failure mode and kill mechanism for military aircraft due to susceptibility of fuel tanks to hostile fire. Unfortunately, testing for HRAM can be cumbersome and expensive. This research sought to provide a numerical analysis method to accurately capture HRAM damage in a bonded-composite fuel tank. The method combined ALE and CZM in a building block approach to model and predict tank failure. A calibrated, coarse CZM model for various T-joints was created based on a RamGun test that utilized the V50 approach to characterize failure pressure. The calibrated model was extrapolated from the joint model to produce a fuel tank model. The model was comparable to an actual fuel tank, complete with skin stiffeners and multiple bays. Tracer nodes were incorporated to track fluid pressures. Four distinct models were created based on the four joint configurations tested in the RamGun—thin base, thick base, and extended joint area for both thin- and thick-base cases.
The models were checked for accuracy by studying the pressure pulses and evolution of the cavity, which proved to match the observed HRAM hydrodynamics. For consistency in comparing the various models, a projectile velocity of 4,000 ft/s was used in conjunction with a projectile-to-spar distance of 13 inches. The thin-base models showed extensive damage. The spar-to-skin joint closest to the projectile impact location exhibited a complete disbond of both bays, and other spar joints were also compromised.
The thick-base model, on the other hand, exhibited much less damage under the same modeling parameters. The primary bay exhibited disbond, but that was the extent of the damage. All the other spar-to-skin joints remained intact. This result reinforces the notion that a thicker base tends to make the overall joint stronger in terms of HRAM resistance. A similar trend was exhibited at the RamGun joint testing level.
Parametric studies were performed on the thick-base model. The first was a study of the effect of projectile velocity. The velocity was increased from 4,000 ft/s to 5,000 ft/s. This resulted in many changes—most notably, a general increase in pressure. The cavity created in the cavitation stage was also much larger due to the higher kinetic energy introduced. The damage increased from being contained only in one bay, as in the 4,000-ft/s model, to include joint disbond in both primary and secondary bays. The other skin-to-spar joint interfaces remained intact and uncompromised.
The second parameter that was studied was the effect of projectile impact distance from the spar. This study was also performed using the thick-base model. The original velocity of 4,000 ft/s was maintained, but the projectile spar distance was altered from 13 inches to 3 inches, moving it closer to the spar. This change resulted in a higher-pressure distribution near the spar since the pressure is higher close to the projectile. The closest spar-to-skin joint experienced a complete disbond in both the primary and secondary bays. The joint at the opposite skin also showed some damage in the primary bay. The other skin-to-spar joints remained intact.
Finally, the other two configurations using increased joint areas for both the thick- and thin-base models were analyzed to assess their resistance to HRAM. The same projectile velocity of 4,000 ft/s and spar distance of 13 inches was maintained for these models. The RamGun test predicted increased strength for the models with increased bond area. For the thin-base model, the prediction was reduced from catastrophic damages to disbond within the primary bay only. The same trend was realized for the thick-base model with the increased joint area. The modified thick-base model showed no damage compared to the baseline line model, which experienced a disbond in the primary bay. In line with the RamGun results, increasing the total bonded area greatly improves HRAM joint resistance and can be used as an HRAM mitigating technique.
Using a combination of empirical data and analytical techniques, we have been able to predict overall joint failure in bonded composite fuel tanks as well as investigate a very promising HRAM mitigation technique. The effects of projectile velocity and impact location on HRAM were also ascertained. This technique employed a coarse mesh in the numerical model, making it computationally viable to study HRAM in large items like fuel tanks and beyond.
ACKNOWLEDGMENTS
The authors want to thank Ron Hinrichsen of Skyward Ltd., who is an industry expert on HRAM simulation, for providing modeling guidance based on his numerous years of experience and Frank Compton of Northrop Grumman Corporation, who continuously provided invaluable insight on HRAM based on his long, live-fire industry experience over multiple platforms.
NOTE: This article was previously presented at the 2020 American Institute for Aeronautics and Astronautics (AIAA) SciTech Forum in Orlando, FL.
REFERENCES
- Varas, D., J. Lopez-Puente, and R. Zaera. “Numerical Analysis of Hydrodynamic Ram Phenomenon in Aircraft Fuel Tanks.” AIAA Journal, vol. 50, no. 7, pp. 1621–1630, 2012.
- Selvarathinam, A. S., M. W. Stewart, S. P. Engelstad, and B. Eby. “Application of Progressive Damage Failure Analysis to Large Aircraft Composite Structures.” The 2018 AIAA/ASCE/AHS/ASC Structures, Structural Dynamics, and Materials Conference, July 2018.
- Adams, R. D. Structural Adhesive Joints in Engineering. London: Chapman & Hall, 1997.
- Sedalor, T., and D. Fleming. “Effect of Total Bonded Area on Hydrodynamic Ram Resistance of a T-Joint.” Proceedings of the American Society for Composites 34th Technical Conference, Atlanta, GA, 23–25 September 2019.
- Noorman, D. C. “Cohesive Zone Modelling in Adhesively Bonded Joints: Analysis on Crack Propagation in Adhesives and Adherends.” M.S. thesis, Delft University of Technology, 2014.
- Turon, A., C. G. Davila, and P. P. Camanho. “An Engineering Solution for Using Coarse Meshes in the Simulation of Delamination With Cohesive Zone Modeling.” Technical report NASA/TM-2005-213547, National Aeronautics and Space Administration (NASA) Langley Research Center, Hampton, VA, March 2005.
- Sedalor, T., and D. C. Fleming. “Numerical Analysis of a Bonded Composite T Joint Subjected to Hydrodynamic Ram Pressures in a RamGun.” AIAA SciTech 2019 Forum, January 2019.
- Heimbs, S., T. Duwensee, A. C. Nogueira, and J. Wolfrum. “Hydrodynamic Ran Analysis of Aircraft Fuel Tank with Different Composite T-Joint Designs.” Structures Under Shock and Impact VIII, pp. 279–288, 2014.
- Hinrichsen, R., S. Stratton, A. Moussa, and G. Zhang. “Hydrodynamic Ram Simulator.” JASPO-V-07-06-001 AAC-TR-08-17, Joint Aircraft Survivability Program Office, September 2008.
- Hull, B. T., T. Sedalor, and T. Mifsud. “Utilization of Hydrodynamic Ram Simulator to Determine the Dynamic Strength Thresholds of Structural Joints.” AIAA SciTech 2019 Forum, January 2019.
- Mansoori, H., and H. Zarei. “FSI Simulation of Hydrodynamic Ram Event Using LS-DYNA Software.” Thin- Walled Structures, vol. 134, pp. 310–318, 2019.
- Li, J., Y. Yan, Z. Liang, and T. Zhang. “Experimental and Numerical Study of Adhesively Bonded CFRP Scarf- Lap Joints Subjected to Tensile Loads.” The Journal of Adhesion, vol. 92, pp. 1–17, 2014.