


SUMMARY
This article describes a multisensor system for measuring the light output and ballistic velocity of pyrotechnic tracers fired from a weapon. The sensors are composed of unbiased silicon photodetectors coupled to 75-mm-diameter aspheric glass lenses. A narrow bandpass filter (center wavelength [CWL] = 665 nm and bandpass = 30 nm) is placed in the optical path, allowing the tracer’s peak spectral emission lines to pass through to the detector yet minimizing the amount of ambient light. This allows light emitted from fired tracers to be measured in all lighting conditions.
INTRODUCTION
Soldiers have long used light emitted from tracers to adjust their weapons to ensure successive rounds strike their intended targets. Tracers are typically packed in a 4-to-1 configuration in automated weapon systems—one tracer for every four ball rounds (nontracer) [1]. One of the most common tracers used by the U.S. military is the red light-emitting tracer, which is used in many different calibers (i.e., 5.56 mm, 7.62 mm, and .50 caliber).
Most tracer manufacturing facilities are high-rate production facilities producing thousands of tracers per hour. As with most military munitions, tracers are produced in lots, and a small number of them are fired on a test range to ensure they meet military specifications. In the United States, tracers are tested at night by firing a specified number of rounds, and downrange human observers score the visibility of the tracer.
To evaluate the 7.62-mm M62 tracer round, human observers are placed behind the weapon at 14 m (15 yd), 91 m (100 yd), and 777 m (850 yd) from the muzzle of the weapon. Each station is located 69 m (75 yd) perpendicular to the firing line. Observers visually score how “well” the tracer performs. For example, if an observer cannot see the tracer, it is classified as “blind.” If the tracer’s flight is erratic, it is classified as “erratic.” The military specification for the cartridge stipulates how many defects (i.e., blinds, muzzle flashes, and erratic flights) are allowed for a production lot to pass the acceptance test. No optics or instrumentation are used in these measurements—only human observers reporting how well they see the tracers. This measurement is very subjective and will vary greatly from person to person.
Human vision and visual perception have been extensively studied for many years. Many models have been developed that describe how humans perceive color and brightness [2]. Over the years, studies have shown that different people will perceive luminous events differently. For instance, one person might describe a luminous object as a deep red while another person might perceive the same light source as a deep pink. The cone‘s (color) and rod‘s (low-light intensity) cells of the eye degrade with age, influencing how people perceive color. Additionally, as people get older, their pupils lose their ability to expand; this limits their ability to differentiate changes in ambient light levels [3].
Over the years, military researchers have developed laboratory techniques for evaluating the light output of pyrotechnic tracers. One of the simplest ways is to statically ignite a tracer in a fixed block (or holder) and measure the light output with a light detector. While this is a quick method for assessing a tracer’s light output, it does not yield a realistic measurement of the tracer’s light output or burn time when fired from a weapon.
A better way to simulate a fired tracer is to ignite a tracer inside a high-rate spin fixture. Researchers have developed fixtures for spinning tracers and measuring the light output at high rotational velocity [4]. Buc et al. describe spinning developmental tracers at 21K rpm (and blowing air along the spin axis) so they could measure the tracer’s light output at non-static conditions [5]. Briere described a turbine-based spin apparatus that can spin tracers up to 300K rpm [6]. In this laboratory, tracers have been spun up to 80K rpm using a pneumatic-based spin device.
While spinning a tracer creates an aerodynamic environment that is more realistic than a static burn, it still does not adequately replicate the conditions the projectile experiences when fired out of a weapon. Tracers spin much faster when fired out of a weapon than what is easily achievable in a laboratory fixture. For example, the calculated rotational velocity of the M62 tracer is around 160K rpm. The calculated projectile spin rate depends on the barrel length and number of grooves per inch inside the gun barrel [7]. Additionally, the projectile spin rate creates aerodynamic forces on the tail of a projectile that affects the burn rate and slag removal (produced from the burning tracer) not easily recreated in the laboratory.
While spinning a tracer creates an aerodynamic environment that is more realistic than a static burn, it still does not adequately replicate the conditions the projectile experiences when fired out of a weapon.
Measuring the light output from a static or spun tracer in a laboratory setting is relatively straightforward. Measurement devices are aimed at either a static or spinning tracer, and the light output is measured with either a single-element detector or charge-coupled silicon device (for spectral measurements). As an example, Brier used a photometer and a broadband radiometer to obtain both eye weighted photometric daytime response measurements and broadband radiometric measurements on tracers spun at different spin rates.
But how do we measure the light output from a live-fired tracer traveling several thousand feet per second? One of the first quantitative methods for measuring the light output from fired tracers was developed by Reilly [8]. In this system, 8-bit video cameras were placed at each of the observation stations (previously described) and linked together with gigabit Ethernet to a central processing station. The data consist of a single video frame with a streaked image. To establish thresholds for passing and failing, two different threshold criteria were developed—the average pixel value and the number of pixels detected within an image. Due to the configuration of this system, measurements were only performed at night.
In this article, a system is demonstrated using low cost commercial-off-the-shelf (COTS) components. Using large area, filtered silicon photodetectors combined with programmable transimpedance amplifiers allows the tracer’s optical emissions to be measured at different ambient light levels. Analog/digital converters allow data from remote detectors (over optical fiber) positioned along the line of fire (LOF) to be collected at a central processing station. Since the output from the detectors is collected simultaneously, the average tracer velocity between adjacent detectors is easily measured. This is the first system that can simultaneously measure both the tracer’s light output and average velocity of a fired tracer projectile using only the light emitted from the tracer.
This is the first system that can simultaneously measure both the tracer’s light output and average velocity of a fired tracer projectile using only the light emitted from the tracer.
EXPERIMENTS
System Schematic
Figure 1 shows the overall layout of the system. The dotted lines represent optical fibers, and solid lines represent coaxial cable. A Mann barrel system was used to fire 7.62-mm M62 red light-emitting tracers. The detectors were placed ~4.3 m perpendicular from the tracer’s LOF. The control module and first silicon detector were placed 50 m from the barrel, the second silicon detector module 150 m from the barrel, and the third silicon detector 250 m from the barrel. The 50-m detector’s transimpedance output was directly connected to the data card in the control module by a 50-ohm coaxial cable while duplex, single-mode fiber optic cables connected the 150- and 250-m detector stations to the control module (located at 50 m). The control module was connected to the computer station by an Ethernet cable. An acoustic trigger (Kapture Group MD1505) was used to send a 5-V transistor-transistor logic pulse when the gun was fired to trigger the data collection system.

Figure 1: Overall Range Schematic of the Tracer Measurement System (Source: J. Poret).
Detectors
The detectors used in this system were 100 mm2 unbiased silicon detectors made by Thorlabs (SM1PD1A). Light was coupled into the detector using a Thorlabs 75-mm-diameter, antireflection, coated, aspheric condenser lens with a focal length of 60 mm (ACL7560U-A). An Omega Optical bandpass filter with a CWL of 665 nm and bandpass of 30 nm was placed in front of the detector. The lens detector distance was optimized by using a white light source placed 2 m away to aid in setting the optimal distance between the lens and the detector and produce the smallest spot size onto the active area of the photodetector.
Amplification
The current output from the detectors was converted to voltage using two different transimpedance amplifiers. The transimpedance amplifier placed at the 50-m detector station was a DL Instruments 1211 amplifier. Stanford SRS570 transimpedance amplifiers were used at the 150- and 250-m detector station due to their built-in RS232 interface, which allowed the amplifier setting to be remotely controlled by RS232 serial commands.
Amplifier Control and Voltage Measurement From the 150- and 250-m Detector Stations
As described, SRS570 amplifiers were used in the 150- and 250-m detector stations. At these distances, Ethernet, USB, and coaxial cables were impractical for sending signals over hundreds of meters. To send and receive signals between the detector stations and the main station, signals were sent over single-mode optical fiber cables using media converters. Serial media converters (Blackbox ME662A-SST) were used to send serial commands to the SRS570 amplifier so gain and voltage offset could be set remotely from the control computer. The transimpedance amplifier’s voltage output was converted to an optical signal and sent over a second single-mode optical fiber with a 14-bit optical/electrical converter (Terahertz Imaging LTX5510-R-1310-14). Figure 2 shows a schematic of the (a) control module and (b) 150- and 250-m detector modules. Wire lines drawn with a dotted line represent a single-mode optical fiber, while solid lines represent copper coaxial cables. Arrows in both diagrams indicate signal direction between components. All of the amplifier outputs were collected at 75 kS/s with a simultaneously sampling 16-bit data card (National Instruments NI-9215) and processed with in-house developed acquisition software.
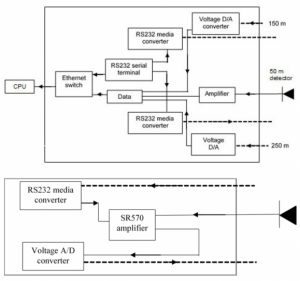
Figure 2: Diagrams of the Control and Remote Modules (Source: J. Poret).
Detector Calibration and Signal Latency Measurement
To calibrate the detectors, a three-lamp integrating sphere (Labsphere) with an integrated spectrometer was used to calibrate each of the filtered detectors. The detectors were positioned 2.7 m from the integrating sphere’s exit aperture (10.2-cm diameter), and six different light levels were used to calibrate each detector. Different light levels were generated using a variable aperture in front of one of the lamps and switching off the other two lamps as required to generate lower light levels. The calibration factor for each detector was generated by taking the slope of the irradiance vs. output voltage (at the amplifier gain used during the measurement) from each detector/transimpedance amplifier module.
Another experiment was performed to measure the latency, or time lag, of the detectors connected by optical fiber to the command module. A modulated red LED (Thorlabs M623L3 and DC2200) was used to generate a square wave from which a time shift in the detector’s voltage output could be measured. The detector was connected to one of the SRS amplifiers, and the voltage output from the amplified detector was split into two using a BNC-T connector. One leg was routed directly to one channel of a four-channel, 350-MHz oscilloscope (Teledyne Lecroy HDO4034), and the other leg was routed into the fiber-based system. The output from the fiber system was routed into a second channel of the oscilloscope.
The time delay between the two legs was calculated using the oscilloscope’s skew function and measured ~1.8 µs. Measurements were performed at square pulse modulation frequencies of 500 Hz and 10 kHz, and the same time delay was obtained for the skew measured at both frequencies.
Spectrometer and Spin Device
An Ocean Optics HR2000+ spectrometer with a 400-µm core fiber was used to collect the emission spectrum of the static and spun tracers. The wavelength calibration of the spectrometer was performed with a Hg-Ar light source, and the radiometric calibration of the spectrometer/fiber was calibrated with a LS-1-Cal light source. The tracers were spun on an in-house designed, pneumatic turbine system.
RESULTS AND DISCUSSION
The need for a responsive, quantitative system that can accurately determine the intensity of fired tracers was the driving force behind this developmental effort. Originally, this system was developed for night measurements but was expanded to include daytime measurements to enhance the system’s functionality. Because tracers are only tested at night, developing a system that can work day and night would be advantageous to manufacturers since it would allow testing at any time. Additionally, range operations would be safer since daytime testing potentially reduces the possibility of accidents that have a higher probability of occurring at night.
Because tracers are only tested at night, developing a system that can work day and night would be advantageous to manufacturers since it would allow testing at any time.
One of the key aspects in developing a system that works in the daytime is understanding the tracer’s spectral emission. Red light-emitting pyrotechnic compositions are typically comprised of strontium nitrate, polyvinyl chloride (a chlorine donor), and magnesium. In a tracer projectile, the tracer composition is pressed into a small cavity in the back of the projectile, followed by the ignition mixture. When the cartridge’s primer is struck by the firing pin of the weapon, the hot particles emitted by the primer ignite the propellant. This, in turn, ignites the ignition mixture and the tracer mixture, causing the tracer composition to emit red light.
The red light-emitting species, SrCl, is a metastable radical that is a very efficient red light emitter [9]. Figure 3 shows the emission spectrum of an unspun M62 tracer and M62 tracer spun at 41.3K rpm. The spectrum is normalized to the peak emission line occurring at 674 nm. Note that the position of the spectral peaks do not shift when a tracer is spun. In general, spinning a tracer will typically increase the burn rate and decrease the amount of light emitted from a tracer [10, 11].
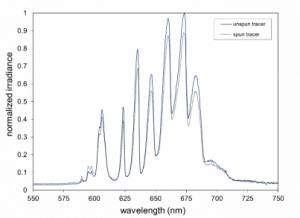
Figure 3: Normalized Spectral Irradiance of a Static and Spun (41.3K rpm) Strontium-Based, Red Light-Emitting M62 Tracer (Source: J. Poret).
Figure 4 shows the solar spectrum emitted by the sun over the tracer’s spectral range. The maximum irradiance was normalized to the peak irradiance value within the 500–700-nm wavelength range [12]. The sun’s intense emission in the spectral range of silicon detectors (300–1000 nm) is why daytime visible light measurements of pyrotechnics is very difficult, especially when large-diameter aspheric lenses are coupled to large-area silicon detectors.
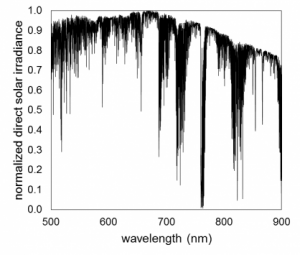
Figure 4: Normalized Direct Solar Irradiance vs. Wavelength Range of the Silicon Detectors (Source: J. Poret).
Early in this program, when the detector modules were tested in full sun conditions (without the narrow bandpass filter), measuring the tracer’s emitted light at high amplifier gains (10-5 A/V and 10-6 A/V) was very difficult due to the ambient light levels normally present during daytime measurements. The resultant output voltage from the amplifier would almost exceed the voltage range of the data card before the tracers were fired from the weapon.
To reduce the amount of ambient light incident on the detector, a COTS narrow bandpass filter was inserted into the optical path of the detector module. COTS filters with different CWLs (and bandpasses) were evaluated by comparing the integrated areas of the M62 spectral emission for each bandpass of the available filters. Initial live testing showed that filters with narrow bandpasses (yet still within the M62 tracer’s spectral emission) were better suited for daytime measurements due to lower levels of ambient light incident onto the detector.
A filter with a center 665-nm wavelength and 30-nm bandpass was inserted into the optical path since it had the largest integrated area compared to the other evaluated filters. Figure 5 shows the filter’s bandpass superimposed onto the normalized spectral emission of the tracer. This filter allows the tracer’s primary emission lines to pass through the filter, yet significantly reduce the amount of broadband light (normally present during daytime measurements) from being collected by the aspheric lens and focusing onto the active area of the detector.
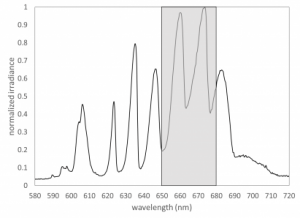
Figure 5: Plot Showing the Spectral Window of the 665-nm Bandpass Filter Superimposed on the Tracer’s Spectral Emission (From Figure 3) (Source: J. Poret).
Another advantage of this multidetector concept is the ability to calculate the average ballistic velocity between adjacent detectors. Traditionally, a tracer’s ballistic velocity is calculated by firing the tracer between two laser screens with a known distance and measuring the projectile’s time of flight between the screens. Using the well-known relationship for velocity,
where v is average velocity, ΔX is the distance between the two laser screens, and Δt is the projectile’s time of flight between the two laser screens. The tracer’s velocity is easily calculated.
Another advantage of this multidetector concept is the ability to calculate the average ballistic velocity between adjacent detectors.
Likewise, the tracer’s velocity between adjacent pairs of detectors can also be calculated. Figure 6 shows a plot of a tracer fired in the daytime, with three detectors collecting simultaneous data. The three amplifier voltage outputs are collected at the same time. The top plot is the output from the detector at 50 m, the middle plot is the detector at 150 m, and the bottom plot is the detector positioned at 250 m. All three plots use the same x- and y-axis units. If one uses the time difference between the peak irradiance from each detector, the average ballistic velocity between detectors 1 and 2 and detectors 2 and 3 can be calculated. For this particular tracer, the average velocity between detectors 1 and 2 was 762 m/s and 695 m/s between detectors 2 and 3. Based on publicly available data for the M62 tracers, the velocity measured between detectors 1 and 2 is very close to the published value of 814 m/s (measured 24 m from the gun barrel) [13].
Figure 6: Irradiance vs. Time for a Daytime-Fired Tracer (Source: J. Poret).
Figures 7 and 8 show other examples of how this system can detect tracers that did not emit light or tracers that emitted low levels of light. Figure 7 shows a “blind” tracer. Note that the tracer irradiance in Figure 8, potentially a dim tracer, is extremely low compared to the tracer shown in Figure 6. Differences in tracer output can be caused by a number manufacturing variables such as incorrect consolidation pressure, varying dwell time, and variation in particle size of fuel and oxidizers used in the igniter and tracer compositions.
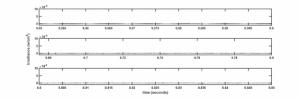
Figure 7: Irradiance vs. Time for a Blind Tracer Fired at Dusk (Source: J. Poret).
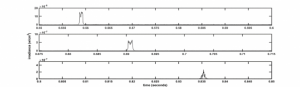
Figure 8: Irradiance vs. Time for a Potentially “Dim” Tracer Fired in the Daytime (Source: J. Poret).
Another important aspect is the detector field of view (FOV). The detector’s angular field of view (AFOV) for a lens coupled to a detector can be calculated using the following equation:
![]()
where h is the height (diameter) of the detector and f is the focal length of the lens [14]. Using the detector’s height and focal length of the lens yields an AFOV of 9.5º. In these measurements, the total FOV the detector sees at 4.3 m from the LOF is approximately 0.71 m. As long as the detector‘s spacing is larger than the detector‘s FOV, there will be no overlap between adjacent detectors.
In this article, a system has been demonstrated that can effectively “map” out a tracer’s irradiance and velocity profile as a function of range distance along the LOF using multiple silicon detectors coupled to large-diameter aspheric lenses (with an appropriate bandpass filter). This system is expandable as the number of detectors in a system will be limited by the data collection system, distance between detector modules (fiber length from detector station to control module), and the detector’s FOV. Latency effects due to the use of analog-to-digital (A/D) converters over optical fibers will have minimal effect on the overall time measurement since the latency time delay corresponds to microseconds and our measurements correspond to tenths of seconds (Figures 6 and 8).
The use of aspheric lenses is also important as large-area aspheric lenses will enable more efficient light collection than other types of lenses (i.e., plano-convex). For example, aspheric lenses can typically be purchased with lower focal lengths than plano-convex lenses of similar diameter, therefore allowing larger FOVs for a given detector-lens combination. Additionally, aspheric lenses will have less spherical aberration, resulting in smaller spot sizes and less blurring than other types of lenses. The large area aspheric lens is also important for collecting light from dim sources since larger lenses will collect more light than smaller lenses.
The use of aspheric lenses is also important as large-area aspheric lenses will enable more efficient light collection than other types of lenses.
This system is vastly different than the camera system developed by Reilly [8]. In their system, the number of pixels and pixel values is analyzed on a single frame per fired tracer. In this system, data are continuously collected by the detectors (once triggered). The data generated by each detector are sampled at the same time since a simultaneously sampling data card is used. It is possible to observe unusual tracer behavior (i.e., fragmentation) if the event occurs within the detector‘s FOV as a function of time due to the high data collection rate of this system. Tracers with low and high light output are easily distinguished from one another. Additionally, the average tracer velocity can be measured for fired tracers by using multiple pairs of detectors.
CONCLUSIONS
A new method of measuring both the tracer’s irradiance and its velocity from the same fired projectile has been demonstrated. Using large-area silicon detectors coupled with large-diameter aspheric lenses enables detecting light emitted from live-fired tracers. The use of fiber optic A/D serial and signal converters allows total flexibility in system design and configuration. Since different calibers of tracers have different test requirements, this system can be easily configured to meet different test requirements. It has the ability to discriminate between blind tracers (unlit tracers) and tracers with varying light output. The ability to discern tracers with different light outputs will enable manufacturers to more accurately assess tracer performance and produce more consistent ammunition. More importantly, this methodology removes subjectivity from the measurements and makes them repeatable and consistent.
Future development of this system will focus on expanding to have more channels and perform side-by-side measurements with human observers to begin determining the minimum irradiance required for passing and failing tracers during lot acceptance testing. Additionally, the system will be optimized by evaluating the effect of detector angle and detector distance from the LOF. Further system optimization will enhance the robustness of the overall design and make it easier for manufacturers to implement this system in their testing facilities.
Acknowledgments:
The author would like to thank the U.S. Army for funding this program and the International Pyrotechnics Society for permission to republish this article as presented at the International Pyrotechnics Seminar USA. Special thanks to Dr. Anthony Shaw, Michael Pagonis, and Christel Kelly (U.S. Army Combat Capabilities Development Command – Armaments Center) for their helpful comments in preparing this article. Data provided by Dr. Gary Glasperal (U.S. Army Engineer Research and Development Center) is also appreciated.
References:
- U.S. Army. Technical manual no. 43-0001-27. Washington, DC, 1994.
- DeCusatis, C. Handbook of Applied Photometry. Woodbury: American Institute of Physics, 1997.
- Society of Light and Lighting. SLL Lighting Handbook. London: CIBSE, 2009.
- Puchalski, W. “The Effect of Angular Velocity and Composition on Pyrotechnic Performance.” Defense Technical Information Center (DTIC), Fort Belvoir, VA, http://www.dtic.mil/dtic/tr/fulltext/u2/a003246.pdf, 1974.
- Buc, S., G. Adelman, and S. Adelman. “Development of Alternative 7.62 mm Tracer Formulations.” DTIC, Fort Belvoir, VA, http://www.dtic.mil/dtic/tr/fulltext/u2/a335414.pdf, 1993.
- Briere, P. “The Effect of High Spin on the Performance of Tracer Compositions.” Propellants, Explosives, and Pyrotechnics, vol. 14, pp. 250–254, 1989.
- U.S. Army Materials Command. Engineering Design Handbook, AMCP 706-188, Alexandria, VA, p. 4, 1974.
- Reilly, S. “The Establishment of Threshold Criteria for Automated Acceptance Test Equipment Based on Battle-field Use of Tracer Ammunition.” The 26th International Symposium on Ballistics, Miami, FL, pp. 1–8, 2011.
- Conkling, J. Chemistry of Pyrotechnics. Boca Raton: CRC Press, 2011.
- Tsai, L., B. Wu, and K. Lin. “Spin Effects on Pyrotechnic Delays of the Molybdenum Family.” Journal of Energetic Materials, vol. 10, nos. 4–5, pp. 267–285, 1992.
- Dillehay, D. “The Effects of Spin and Liner Thickness on Illuminant Performance.” Proceedings of the 11th International Pyrotechnic Seminar, Vail, CO, pp. 103–117, 1986.
- Ontar. PcModWin5 v1.3.1. North Andover, MA, 2010.
- Northrop Grumman. M62 Product Specification. https://www.northropgrumman.com/ Capabilities/7-62mmAmmunition/Documents/M62FactSheet.pdf, accessed June 2019.
- Boreman, G. D. Basic Electro-Optics for Electrical Engineers. SPIE Optical Engineering Press, 1998.