


INTRODUCTION
Directed energy weapons (DEW)— which include high-energy lasers (HELs), high-power radio-frequency (RF)/ microwaves (HPMs), and particle beam weapons—pose a potentially high-risk threat to U.S. sensors, communications, and weapon systems. Several foreign countries are currently interested in and are developing DEW systems. The Department of Defense (DoD) is concerned that DEWs could attack friendly personnel, facilities, and/or equipment with the intent of degrading, neutralizing, or destroying their capability. Figure 1 shows some examples of DEW applications for land, air, space, and sea. The red lines depict the HEL beam, and the curved lines represent HPM energy.
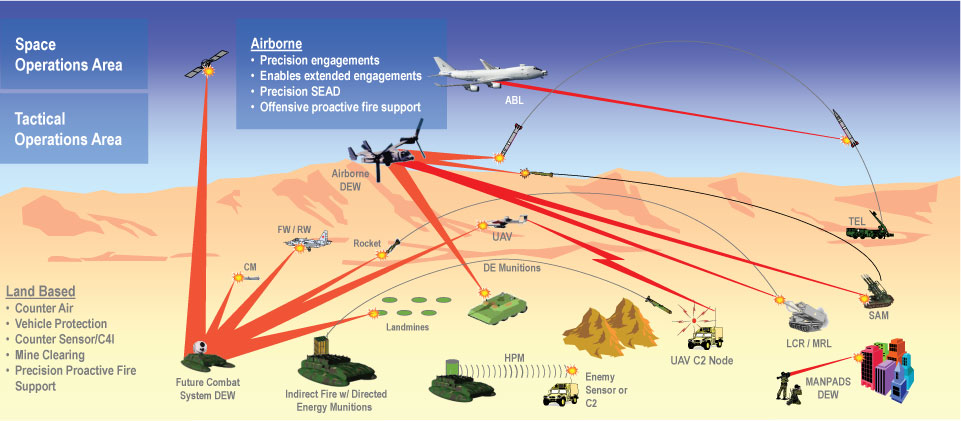
Figure 1: Possible Applications for Directed Energy Weapons (Source: DoD HPM DEW Effects Panel)
HELs are high-powered light sources combined with optics that are designed to focus the beam of light on a target and create sufficient heat to burn holes in the outer skin. HELs can be chemical-based or solid-state, including bulk and fiber optics. Advances in solid-state and fiber-optic lasers in recent years make them a potential game-changer on the battlefield. HELs have the potential to attack targets with the speed of light and typically operate at wavelengths that are outside the visible range of the human eye. HELs can be mounted on ground, air, or space vehicles to attack targets.
HPM weapons are high-power RF/ microwave transmitters that are combined with antennas to direct energy at a target and produce electronic upset or permanent damage depending upon the distance between the HPM source and the target. HPM weapons can operate in any weather condition, and their beams are typically much wider than a laser beam, which increases the probability of target hit. HPM weapons produce their effects by coupling energy into a target system via intentional antennas (i.e., front doors) and unintentional antennas (i.e., back doors) and transferring the energy to sensitive semiconductor components.
RF DEWs include HPM, electromagnetic (EM)/RF weapons, non-nuclear EM pulses, and electronic bombs (E-bombs). They provide a Warfighter with the capability to attack electronic targets, with and without antennas; and they produce long-lasting effects that offer an unconventional electronic attack (UEA) that complements traditional electronic warfare (EW) jammers [1].
The typical approach to protect systems against DEW threats is a zonal approach where one tries to decrease the energy that impinges on the target and increases the robustness of the interior components. For HELs, this approach typically means two things: covering the potential victim system with materials that can reflect the laser energy and withstand the heat, and covering the sensors and optics with materials that reflect the incident energy.
If one knows the laser fluence required to cause damage to a victim system, S, and the exposure level of the threat laser, E, then one can compute the amount of attenuation or hardening, H, required to reduce the threat below the damage level:
H > S/E
Ideally, it is useful to cover a victim system with a material that has high reflectance and robust thermal properties.
For HPM threats, the effect mechanism is different than lasers and typically involves coupling the HPM energy from the skin of a victim system to the interior electronic components. Therefore, for HPM protection, this fact means reducing the energy that is transferred to the electronics and increasing the robustness of the components. Because it is difficult to harden all the components, the approach usually taken is to reduce the HPM energy that reaches the interior electronics by first providing a good electromagnetic shield, using good grounding, bonding, and shielding techniques, such as those used in electromagnetic compatibility (EMC). Next, we treat the ports of entry (i.e., penetrations) with filters to remove the out-of-band energy and limiters to reduce the in-band energy from damaging the component [2].
METHODOLOGY
Figure 2 shows a methodology for hardening systems against an HPM threat level, E. The “protection requirements” block in the figure shows how one can use the susceptibility level of a victim system, S, to compute either the hardening level, H, or the keep-out range, R, required to protect the victim system. H represents the amount of attenuation required between the HPM port of entry and the susceptible component or the hardening level. R represents the separation distance required between a victim system and an HPM threat to ensure that the threat exposure level is below the system’s susceptibility level.
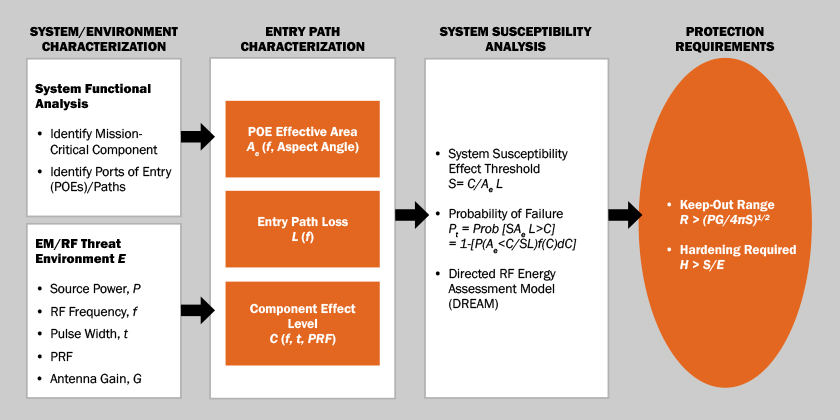
Figure 2: A Methodology for Estimated Hardening Requirements and/or Keep-Out Range for Victim Systems (Source: SURVICE Engineering).
Ideally, it is best to measure the HPM susceptibility level of a victim system rather than depending upon estimated levels. This measuring requires irradiating a monitored system with increasing levels of HPM power density and noting any effects on the system operation. Because the HPM susceptibility level of a system is not only a function of the incident power density but also the frequency and modulation (i.e., pulse width and repetition rate) of the waveform, it is important to cover all the threat parameters.
In 1992, the Harry Diamond Laboratories (which are now part of the U.S. Army Research Laboratory [ARL]) developed a set of HPM Hardening Design Guides (shown in Figure 3) to assist system developers in hardening their systems against HPM threats. Volumes 1–3 of the handbooks are unclassified and available through the Defense Technical Information Center (DTIC). Volume 4 is classified and contains test data on U.S. and foreign systems [2].

Figure 3: HPM Hardening Design Guide for Systems (Source: AFRL) [2].
HPM HARDENING EXAMPLE
The following text provides a notional example of how to harden a helicopter system against an HPM DEW weapon using the aforementioned methodology. The purpose of the example is to demonstrate how to develop hardening requirements, H. These requirements can be thought of as the amount of attenuation that must be introduced in the entry paths to ensure the threat HPM energy reaching the helicopter, E, is below the helicopter’s susceptibility level, S. Following the flowchart shown in Figure 2, the first step is to define the threat parameters and perform a functional analysis on the helicopter to identify mission-critical component and associated HPM entry paths to the components.
HPM Threat Environment
For this example, assume that the HPM threat is a high-power transmitter that can produce 1-μs, 1-GHz (L-band) pulses at a peak power of 1,000 MW with a pulse repetition frequency (PRF) of 100 Hz. Also assume that the transmitter is combined with a parabolic reflector-type antenna with a gain of 500 (27 dB). Note that these parameters are entirely fictitious and are used only to show the hardening methodology.
The Directed Radio Frequency Energy Assessment Model (DREAM), which is used for this example, is a one-on-one engagement model that simulates the interaction between a defined HPM weapon and a target system. The model computes the probability of target failure as a function of the incident RF power density on the target and the separation distance between the threat and target (range). DREAM was developed by ARL and one of its contractors, SPARTA Inc., in the 1990 time frame. It runs on a standard personal computer (PC) using Microsoft Windows [3]. The model manager for DREAM is currently the Air Force Research Laboratory (AFRL) in Kirtland AFB, NM. Figure 4 shows DREAM’s input screen, which summarizes the key threat parameters.

Figure 4: Source Parameters for Notional HPM Weapon Threat.
System Functional Analysis
The next step is to identify the mission-critical subsystems on the helicopter and their associated critical electronic components. Figure 5 shows a notional helicopter and the mission-critical subsystems we have identified. Next, we try to identify the likely entry path for the HPM energy to enter a port of entry (POE) on the helicopter and travel to the component. For example, we have identified the radio as a critical subsystem since its failure could lead to a loss of communications. Within the radio, we identify the RF front-end mixer since the radio cannot demodulate the incoming signal with a damaged front end. Therefore, the entry path for the radio consists of the signal path from the ultra-high frequency (UHF) antenna to the RF front end. The next critical subsystem we identified is the engine control unit. The engine control system does not have an antenna, but it does have an unintentional antenna in terms of the cable leading to the transistor control box. Continuing to follow the methodology, we see that the next critical subsystems identified are the fire control computer and the flight control computer. Each has a wire cable as a POE leading to Transistor-Transistor Logic (TTL) control circuits.
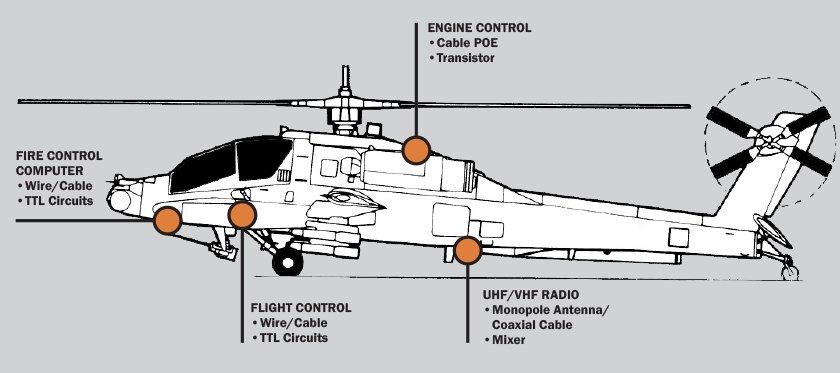
Figure 5: Functional Analysis for Notional Helicopter to Identify Mission-Critical Electronics (Source: SURVICE Engineering).
Failure Analysis Logic Tree
After identifying the critical subsystems, we develop a Failure Analysis Logic Tree (FALT) that shows the relationship of the subsystems to the operation of the overall helicopter. Figure 6 shows a FALT for the example helicopter generated by the DREAM model. The FALT shows not only the relationship between the subsystems but also the failure modes being considered and their criticalities. For this example, we are considering two major failure modes for the helicopter: Mission Abort and Forced Landing. We assume that if either mode occurs, the helicopter will fail. For Mission Abort, we assume that the radio and/or fire control computer must fail. Both are considered equally critical and, therefore, the reason for the number one in the criticality box. For Forced Landing, we assume that the engine control and/or flight control must fail. Again, they are both considered to be equally critical.
At the bottom of the FALT are the actuators that lead to the failure of the subsystems. The actuators represent the combination of the POE, entry path, and critical component. Specifically, they represent the power required to fail the critical component, Pc, the attenuation (or loss) of the entry path from the POE to the component, L, and the effective area of the POE, Ae.
Entry Path Characterization
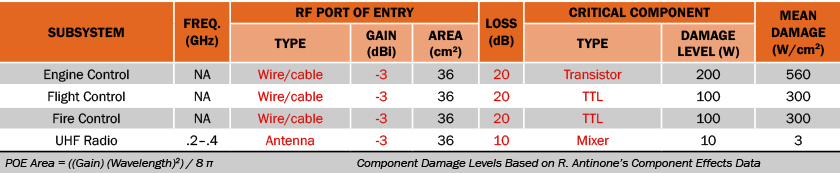
We can characterize the entry paths discussed in the previous section by defining the type of POE, the path loss, and the type of mission-critical component. Table 1 shows a summary of the parameters for each of the critical subsystems being considered. The numbers shown in red are the inputs for the DREAM model; the numbers in black are computed by DREAM and are not required as inputs. Based on these inputs, DREAM computes the probability of failure for each of the actuators and then propagates the numbers up the FALT to compute the probability of failure for each of the nodes. For example, for the engine control computer, we previously defined the type of POE as a wire/cable. The gain for a wire/cable for out-of-band energy is estimated to be -3 dB [4]. Next, we estimate the attenuation of the entry path from the POE to the components. Based on experiments, we estimate a loss factor of 100 or 20 dB. Finally, we identify the type of component as a transistor. The mean damage level for a transistor for a 1-μs, 1-GHz pulse is estimated to be about 200 W [2]. Following the same procedure, we characterize the remainder of the entry paths.
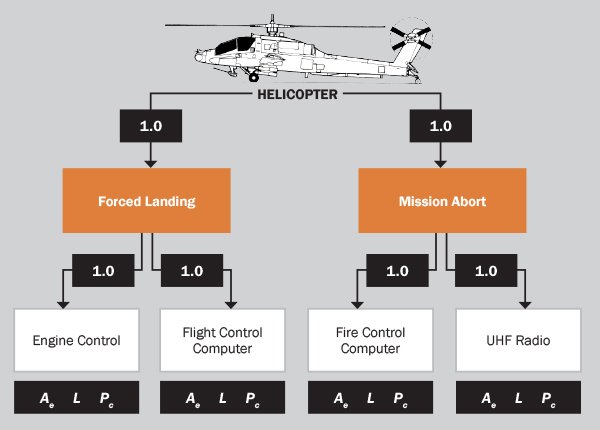
Figure 6: FALT for Helicopter Showing the Mission-Critical Subsystems and Components.
(The numbers near the links represent the conditional probability that if the lower node fails, so will the upper node.
The 1.0 means that if the lower node fails, then the upper node will fail.) (Source: SURVICE Engineering)
Table 1: Entry Path Characterization for Example Helicopter
Probability of Failure (Damage) vs. Incident Power Density and HPM Threat Range
We compute the probability of failure of the helicopter subsystems based on the probability that the power received at the component, Pr, is greater than the component failure level, Pc. Because both Pr and Pc are essentially random variables, the probability of failure of a subsystem is equal to the difference of two random variables, which corresponds to the convolution of the Probability Distribution Function (PDF) of Pr with the PDF of Pc. DREAM computes the probability of failure of each of the mission-critical subsystems and then combines them using Boolean algebra to compute the probability of each node of the FALT [3].
Based on the threat parameters shown in Figure 4, the FALT shown in Figure 6, and the entry path parameters in Table 1, Figure 7 shows the probability of failure (damage) of the example helicopter that was computed by DREAM as a function of the HPM weapon’s power density and range for the cases of Mission Abort and Forced Landing. The HPM weapon’s power density is shown at the bottom in watts/square centimeter, and the range is shown at the top in meters. Because the probability of helicopter failure was based on either Mission Abort or Forced Landing, the curve for Forced Landing represents the overall probability of helicopter damage.
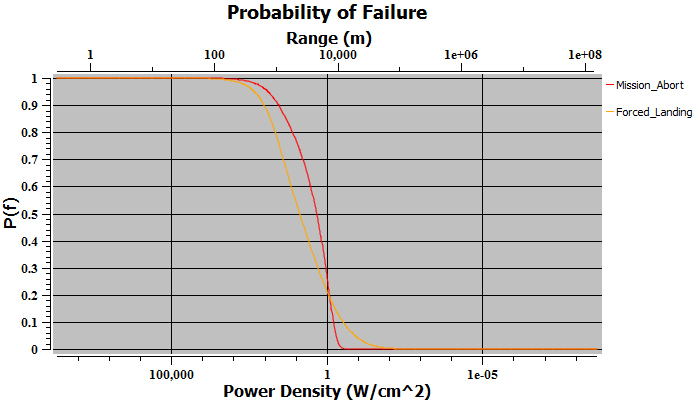
Figure 7: Probability of Failure for Example Helicopter Showing Forced Landing and Mission Abort.
For example, we see that the weapon power density required for a 50% probability of helicopter damage is estimated to be about 10 W/cm2 and occurs at a range of about 1,000 km. Because we want to ensure that the helicopter is hardened against the worst-case threat, we select a conservative value of 10% probability of damage to develop our hardening requirements. One can choose a lower probability, but this choice can lead to overhardening, which is expensive in cost and weight penalty.
Hardening Requirements
Finally, we use the susceptibility level of the helicopter to compute the hardening requirement using equation 1. Based on Figure 7, the power density associated with a 10% probability of damage is about 1 W/cm2, which is the helicopter’s susceptibility level for a 10% probability of damage. This can occur at a separation distance between the weapon and helicopter of about 10 km. If we want to harden to a maximum threat level of 1,000 W/cm2, then the
Hardening Level Required = H = S/E = 1 W/cm2/100 W/cm2 = 0.001 (>30 dB of attenuation).
The FALT shows not only the relationship between the subsystems but also the failure modes being considered and their criticalities.
Therefore, for this example, we estimate that the helicopter will need at least 30 dB of hardening added to the entry paths to ensure that the threat energy reaching the critical components is below the failure level. To achieve this level of hardening, one could use a dual-PIN diode limiter that can provide at least 40 dB of front-door protection or RF shielding materials that can provide greater than 30 dB of protection [2].
SUMMARY
Foreign-made DEWs represent an evolving threat to U.S. military systems and civilian infrastructure. This article has described a methodology that can be used to countermeasure DEWs and reduce their effects. It must be emphasized, however, that each case is different and depends upon the DEW threat parameters and the susceptibility level of the victim system. If possible, any hardening requirements should be based on the measured susceptibility level of the system. However, if this basing is not possible, the methodology described herein may be considered. In addition, interested readers are encouraged to contact the intelligence community to get the latest information on both HEL and HPM threats.
References:
- Tatum, J. “HPM DEWs and Their Effects on Electronic Targets.” DSIAC Journal, vol. 4, no. 3, summer 2017.
- Casper, J. E. (editor). “High-Power Microwave Hardening Design Guide for Systems.” HDL-CR-92-709-5, U.S. Army Harry Diamond Laboratories, Adelphi, MD, April 1992.
- Tatum, John T., Karen R. McLaughlin, Robert E. O’Connor, and Anthony N. Valle. “Operator’s Guide for DREAM: Directed Radio Frequency Energy Assessment Model.” Version 0.1, ARL-TR-479, Revision 1, JTCG/AS -95-M-001, August 1996.
- Hayes, S. T., and R. V. Garver. “Out-of-Band Antenna Response.” Proceedings of 1987 IEEE International Symposium on Electromagnetic Compatibility, 87CH2487-7, Atlanta, GA, August 1987.