


INTRODUCTION
Energy is a fundamental enabler of military capability. However, world population growth, increase in developed populations requiring greater demand on energy, rebalancing to the Asia-Pacific region, next-generation weapons platforms, and concepts of operation (CONOPS) prompt an enduring challenge for the availability and cost of operational energy for future campaigns. Operational energy is defined as “energy required for training, moving, and sustaining military forces and weapons platforms for military operations” [1]. An overarching challenge to supporting our Warfighters comes from the dependency and resupply of food, water, ammunition, and liquid fuel. With a possible increase in operational tempo on the rise in support of rebalancing against great-power competitors and their fortified anti-access/area denial (A2/AD) and information regions, the indefinite necessities and associated support logistics will become immeasurably taxing, with increased risk of uncertainty.
An overarching challenge to supporting our Warfighters comes from the dependency and resupply of food, water, ammunition, and liquid fuel.
However, technological and market trends in robotics, artificial intelligence (AI), and directed energy (DE)/electromagnetic (EM) weapons (as a weapon against adversaries and/or a wireless power recharger for our platforms) incorporated with novel CONOPS offer opportunities to offset these challenges. This also provides leap-ahead preeminence for America’s innovative academic, industrial, and military bases with their scientific and technological marvels, paired up with our unparalleled military Warfighters. Through increased robotic presence and tasking, we can decrease human Warfighter presence from risky missions and tasking, thus essentially reducing the food and water challenges albeit with greater electrical power demands. Through DE and EM weapons, we can reduce the ammunition challenge albeit with greater electrical power demands. And through wireless power beaming, we can reduce dependency on liquid fuel as a source of energy; in turn, we can reduce the logistics tail through developing a sustainable mobile electrical infrastructure tailored to support greater electrical demands.
However, many throughout the world are investing in this future in some aspect as the character of war is changing [2]. Whoever achieves a harmonious integration of these technologies (i.e., robotics, AI, DE/EM weapons and recharging, etc.) inserted into novel strategical and tactical CONOPS first will vastly benefit from the resultant whole as the “whole is greater than the sum of its parts.” Recognizing that electrical power is a key enabler to fully realizing this, future research and development investigation efforts are taking place at the U.S. Naval Surface Warfare Center (NSWC) – Crane Division in Crane, IN. These efforts include a diverse team of engineers and scientists to address the question on how to create a sustainable mobile electrical infrastructure. This article looks to wireless power (WP) as an enabler for achieving a sustainable mobile electrical infrastructure.
FUTURE ENERGY-INTENSIVE CAPABILITIES
In pursuit of military dominance, there is an ever-increasing demand for more energy, albeit with ever-increasing capabilities. Some areas of growth to aid the Warfighter include robotics with increasing functionalities, directed energy, and EM weapons, which are ever-increasing and energy-intensive.
Robotics with increasing functionalities continue to accelerate their utility to support the Warfighter. Part of the Naval science and technology (S&T) strategy [3] autonomy and unmanned systems vision is to achieve an integrated hybrid force of manned and unmanned systems. Moreover, The U.S. Army is pursuing a robotic and autonomous systems strategy [4] aimed at integrating new technologies into future organizations focused on human-machine collaboration. Some expected outcomes of human-machine teaming will be as a force multiplier, reducing risk to the Warfighters, lightening their physical and cognitive workloads, and offering greater lethality. To achieve greater robotic tasking with the Warfighters, it is vital that the U.S. Department of Defense (DoD) recognize and address Warfighter concerns [5] such as establishing trust [2, 4–6] and maintaining energy support systems.
DE and EM weapons continue to accelerate their need to support the Warfighter. For DE, this includes high-energy laser and high-powered microwave technologies. For EM weapons, this includes electronic warfare (EW) in the radio frequency (RF) and electro-optical/infrared (EO/IR) systems and rail-gun technologies. All these are energy-intensive but offer immense benefits in overmatching adversaries.
DEPARTMENT OBJECTIVES
Part of the Naval S&T strategy [3] power and energy vision recommends increasing naval forces, freedom of action through energy security, efficient power systems, and combat capability through high-energy and pulsed power systems. This strategy vision also recommends providing the desired power where and when needed at the manned and unmanned platform, system, and personal levels. Some of the objectives set by the DoD to achieve this vision include increasing utility of renewables, improving operational energy assurance, and reducing resupply burden and logistics vulnerability [3, 7]. To support these future developments, we look to WP as an enabler for achieving a sustainable mobile electrical infrastructure.
WIRELESS POWER
Two primary forms of WP are near-field resonant inductive coupling and far-field power beaming. The former includes a set of coils (transmitting and receiving) separated by a short distance, where electrical power is transferred wirelessly via magnetic field energy. Applications of resonant inductive coupling can be seen in wireless cell phone or toothbrush chargers, for example. Resonant inductive coupling technology is being explored to recharge robotics. The latter typically includes either laser or RF wavelengths where electrical power is transferred wirelessly from a transmitter to a receiver unit at much greater distances via light or electric field energy, respectively. Far-field WP transfer technologies are explored as a capability to power robotics at a greater distance away from a transmitting station, such as wirelessly powering an unmanned aerial vehicle while still in flight. In fact, Mr. William Brown of Raytheon Corp., considered a pioneer of WP technologies and applications, developed and demonstrated a WP beam used to power and position a helicopter back in the late 1960s under a contract from the U.S. Air Force [8]. The holy grail of far-field WP beaming is the concept of a large, solar-powered satellite used to harvest immense amounts of solar energy in space, convert the solar energy into an RF power beam transmitted to Earth where it is received, and convert to usable direct current (DC) power by a rectifying antenna (rectenna) array. Several more applied examples of WP beaming exist and can be found in Strassner and Chang [9].
The holy grail of far-field WP beaming is the concept of a large, solar-powered satellite used to harvest immense amounts of solar energy in space.
Researchers and scientists at NSWC Crane are conceptualizing and pursuing realization of various CONOPS themes enabled by WP technologies with integrated robotics and Warfighter teaming toward developing a sustainable mobile electrical infrastructure.
WP ASSESSMENT TOOL
A WP tool was developed to provide rapid assessment of various WP scenarios (e.g., satellite-to-ground or aerial, space-to-space, ground-to-ground or aerial, and aerial-to-ground or aerial). Figure 1 shows the WP assessment tool that Crane developed [10]. The tool currently contains tabs for WP analysis and two other tabs (i.e., coplanar strip-line analysis and diode analysis), with future work allowing more assessment capability. Built using numerous existing formulas, closed form equations, measured data, and creativity in the functionalities and displays, this tool is designed to elegantly stitch complex correlations between design variables and the bounding laws of physics to provide a good estimation of expected DC power output.
![Figure 1: The Wireless Power Analysis Tab Display of the WP GUI Tool Containing Input and Output Variables Sections (Source: Bergsrud and Zellner [10]).](/wp-content/uploads/2019/11/dsiacjournal_winter2019_wirelesspower_bergsrud_fig1.png)
All tabs have a “Click Here for Operating Instructions” button. These instructions include supporting equations and formulas with references, detailed descriptions of components on the graphical user interface (GUI), and step-by-step example walk-throughs for each of the three tabs.
In Figure 1, two main sections of the GUI are Input and Output Variables. Included in the Input Variables section is the Parametric Analysis section and edit boxes for all dependent and independent input variables. Included in the Output Variables section are the efficiency graphs, analysis summary table, and DC power output graph.
The parametric analysis box allows the user to enter parametric study information (i.e., dependent and independent variables) collectively saved as a data point for each instance. The user would first select an independent variable (i.e., frequency, transmit power, separation distance, and receive aperture or transmitter aperture areas) of interest to study. The selected independent variable is highlighted in a turquoise color for convenience to the user. The user would then enter dependent variable values. The dependent variable values will remain fixed for each data point, while the independent variable will change based on user inputs toward their study of interest. Quick iterative changes can be made to all variables, allowing users to rapidly assess correlated effects on intermediate and output values while automatically updating their data points for those charges.
After the user has entered enough data for the appropriate variables, the efficiency graphs in the center column of Figure 1 will start to populate. The collection efficiency graph displays the percentage of the propagating wave collected on the interface of the receiving aperture (as a function of transmit and receive aperture sizes, frequency, and distance). The atmospheric efficiency graph displays the percentage of the propagating wave not attenuated in the atmosphere (as a function of frequency). The rectenna RF-to-DC conversion efficiency graph displays the percentage of the collected wave on the receiver converted to DC power (as a function of power density).
All input variables, efficiencies (including total efficiency), and relevant output variables (i.e., power density, DC power output, and minimum allowable distance) for all data points are displayed in the analysis summary table of the Output Variables section.
The total DC power output is the product of the three efficiency values and the transmitted power value. This output value is plotted against the user-selected independent variable for all data points in the DC power output graph shown in Figure 2. This graph helps the user compare and analyze data points so he or she can study how variations in the chosen variable affect the resulting estimated availability of DC power. For example, this graph can be used to study zones (green, yellow, and red) of available power.
![Figure 2: End-Result Displaying Estimated DC Power Plotted to Help the User Compare and Analyze Data Points (Source: Bergsrud and Zellner [10]).](/wp-content/uploads/2019/11/dsiacjournal_winter2019_wirelesspower_bergsrud_fig2.png)
While using the tool, a user may encounter a warning pop-up (see Figure 3) that can be fixed by changing the input variables. Electrical components can be destroyed or burnt out if they receive more power than designed to handle or fail to turn on if too little power is received. The GUI is designed to help catch these bounds and notify the user.
![Figure 3: A Warning Dialog Box That Appears If the Power Density Exceeds a Certain Threshold (Source: Bergsrud and Zellner [10]).](/wp-content/uploads/2019/11/dsiacjournal_winter2019_wirelesspower_bergsrud_fig3.png)
To increase the accuracy of DC power output estimation, three pop-out sub-GUIs are available to the user that allow more specific information to be entered as they pertain to receiver and transmitter orientations, atmospheric attenuation of the power beam, and measured RF-to-DC conversion information. These sub-GUIs can be accessed by pressing one of the three buttons above the respective three efficiency graphs.
The physical configuration sub-GUI (Figure 4) allows the user to set altitudes and transmit and receive antenna orientations in a two-dimensional configuration. Based on those inputs, it allows the user to generate a visual display of his or her configuration settings. Cosine loss factors are incorporated in this assessment.
![Figure 4: Physical Configuration Sub-GUI (Source: Bergsrud and Zellner [10]).](/wp-content/uploads/2019/11/dsiacjournal_winter2019_wirelesspower_bergsrud_fig4.png)
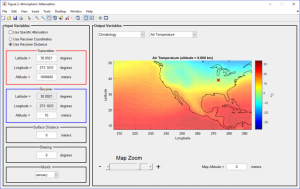
The atmospheric attenuation sub-GUI (Figure 5) allows the user to set atmospheric conditions for a more accurate atmospheric efficiency calculation by using specific attenuation equations from the International Telecommunications Union and a built-in climatology database from the National Oceanic and Atmospheric Administration’s Earth System Research Laboratory [11, 12].
The atmospheric attenuation sub-GUI allows the user to set atmospheric conditions for a more accurate atmospheric efficiency calculation.

The open library sub-GUI allows the user to input and save their own rectenna RF-to-DC conversion efficiency data (Figure 6) as a function of power density and view data from other reputable sources [13–15].
![Figure 6: Rectenna RF-to-DC Conversion Efficiency Data Pop-out Sub-GUI (Source: Bergsrud and Zellner [10].](/wp-content/uploads/2019/11/dsiacjournal_winter2019_wirelesspower_bergsrud_fig6.png)
The variables in each of the sub-GUIs are autopopulated to default values so that new users may focus on the main input variables if desired, without opening these sub-GUIs.
WP From Satellite-to-Ground Assessment
One assessment of interest is using a satellite(s) beaming power to ground operating bases. The physical configuration pop-out sub-GUI (Figure 4) allows the user to set the altitude of the satellite as well as orientations of the power transmitter (on a satellite) and a power receiver, i.e., rectifying antenna (rectenna) array on the Earth.
Footprint Study
A first study of the satellite-to-ground scenario is setting the receiver aperture area to be the independent variable, with all dependent variables set constant. Three example diameter sizes were selected for candidate operating bases: 25-m remote operating base, 100-m forward operating base, and a 250-m main operating base. The result of this study is shown in Figure 7.
![Figure 7: A Study Example to Estimate the Amount of DC Power Received for Theoretically Different-Sized Operating Bases From a Satellite at 500 km (Source: Bergsrud and Zellner [10].](/wp-content/uploads/2019/11/dsiacjournal_winter2019_wirelesspower_bergsrud_fig7.png)
Orbit Study
In addition to studying the amount of power received by these three types of operating bases, another valuable study comes from the cosine loss effects of a solar-powered satellite passing over the operating bases (Figure 8). The estimated total amount of DC power received at an operating base is maximized when the satellite is directly over the receivers and diminishes as the satellite continues its orbit. This is achieved by maintaining altitude of the satellite and increasing/decreasing the ground separation distance. The overall distance, as well as the angle of the incident wave, changes between data points, thus affecting the overall DC power.
![Figure 8: Effects of a Solar-Powered Satellite Passing Over Operating Bases (Source: Bergsrud and Zellner [10]).](/wp-content/uploads/2019/11/dsiacjournal_winter2019_wirelesspower_bergsrud_fig8.png)
SUSTAINABLE MOBILE ELECTRICAL INFRASTRUCTURE
MG Mick Ryan of the Australian Army stated “… technology alone is unlikely to provide a sustained competitive advantage. But when new technology is combined with new operating concepts and new organizational models, innovation is more likely to provide sustained advantage” [2]. In-pursuit of developing a sustainable mobile electrical infrastructure, Crane developers engaged with Warfighters and explored various robotic concepts applied in theater that may bring positive value gain. Moreover, a diverse team of Crane developers explored WP utility, robotic, and Warfighter integration concepts as possible future tactic and strategic realities toward developing a sustainable mobile electrical infrastructure to support that vision.
Better Understanding the Warfighter’s World
Crane scientist and engineers working on the sustainable mobile electrical infrastructure concepts have been interacting with Warfighters to better understand how they see the world (i.e., day-in-the-life or customer discovery process and then identify possible robotic tasking). Two key interactions occurred relative to this work—(1) brainstorming session with Explosive Ordinance Disposal (EOD) detachment group at NSWC Crane Division and (2) Expeditionary Maneuver Support Directorate war-gaming exercise for camouflage, concealment, and deception. In both cases, the developers and Warfighters worked together to come up with operational use cases of robotics catered to certain scenarios. Further literature reviews revealed that using robotics for EOD is one area of overlap between the Army and the Navy [16]. Thus, to help build trust between robotic tasking and the Warfighters, NSWC Crane developers targeted their concept development efforts towards EOD themes.
Proposed Concept
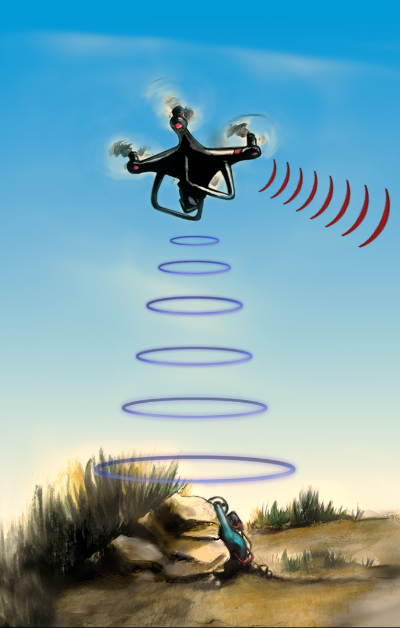
A vehicle that Warfighters are familiar with is the all-terrain vehicle (ATV). Thus, NSWC Crane developers are working toward a robotic ATV with integrated mission robots and wireless power-recharging capability, as seen in Figures 9–11. The robotic ATV or mother bot (Mbot) can work semi-autonomously without a Warfighter passenger or be driven by a Warfighter. Mbot will be equipped with two near-field WP charging pads in the rear for recharging two multirotor copter aerial daughter bots (A-Dbots). A-Dbots will play the role of scouts to help increase situational awareness around Mbot. In addition, Mbot will be equipped with an electrical power system (EPS) kit, including a hybrid solar/RF array, storage bank, and power management system designed to support both Mbot and A-Dbots. Moreover, an ATV trailer equipped with an EPS kit with a WP charging pad could support a rover daughter bot (R-Dbot).


Both EPS packages will enable longer mission durations by integrating energy capability.
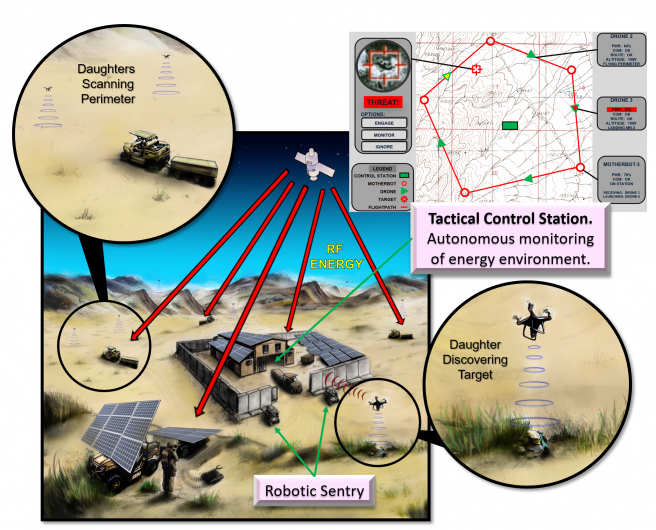
Finally, Figure 12 illustrates a possible future force protection and wireless energy delivery from satellite CONOPS. The satellite beams power to the mobile electrical infrastructure for recharging, thus reducing the traditional fuel logistics reenergize approach. In addition, Figure 12 shows an integrated Warfighter and/or multiagent robotic systems (Mbot and Dbots) teaming force protection architecture to a base station tactical command center with energy monitoring.
CONCLUSION
As the United States evolves to rebalance against rising great power competitors as a global leader, it must leverage and unleash its greatest asset—our innovative minds and support structure—for a new robotic age to overmatch and provide leap-ahead dominance in rapidly growing key technology areas. In helping to pivot against this challenge, developers at NSWC Crane developed a WP assessment tool and conceptualized a sustainable mobile electrical infrastructure composed of WP utility, robotics, and Warfighter integration. Crane developers have engaged with Warfighters in a customer discovery process approach to better understand the Warfighters’ world and then apply new concepts into that world, with the Warfighters as a reality check and value proposition. Integrating robotic tasking with Warfighters designed toward an EOD theme was a good first approach.
Near-field WP utility offers a way to autonomously recharge robots without Warfighting presence.
Increasing robotic tasking reduces Warfighter cognitive and physical loads, keeps them further out of harm’s way, and increases lethality of the force. This, in turn, may help reduce the food and water resupply challenges. To support a higher electrical demand through autonomous robotic tasking increase, developers are looking at a WP utility to sustain a forward robotic presence. Near-field WP utility offers a way to autonomously recharge robots without Warfighting presence. Moreover, far-field WP utility offers a way to electrically recharge mobile Earth-operating base stations from space, thus reducing traditional energy resupply lines’ vulnerabilities. Integrating WP and robotics with Warfighters may offer a longer, sustained advantage against adversaries as well as claim and grow key market space through DoD-generated American innovations.
Acknowledgments:
From NSWC – Crane: the authors would like to thank summer interns Katherine Pfeiffer (Pathways) and Kristina Salvatore (Naval Research Enterprise Internship Program [NREIP]) for contributing to the WP GUI tool; Dr. Amy Wagoner, Tim Murphy, and Michael Petry for their inputs to robotics and networks; and Pete Avenatti, Joseph Bailey, Braden Yake, and Jason Miller for their inputs and demonstrations of the ATV unit. From NSWC – Carderock: the authors would like to thank James Mulford, Dr. Robert Stark, Joseph Curran, Kevin Lin, and Keith Schlee for their inputs into inductive wireless power.
This work was supported by the DoD; NSWC – Crane Division under The Naval Innovative Science and Engineering (NISE) Program; the Pathways internship program; and NREIP.
References:
- 10 U.S. Code § 2924. “Armed Forces.” Supplement 3, 2012.
- Ryan, M. “Human-Machine Teaming for Future Ground Forces.” Center for Strategic and Budgetary Assessments, 2018.
- Office of Naval Research Science & Technology. “Naval S&T Strategy – Innovations for the Future Force,” 2015.
- The U.S. Army Training and Doctrine Command. “Robotic and Autonomous Systems Strategy.” Maneuver, Aviation, and Soldier Division Army Capabilities Integration Center, Fort Eustis, VA, March 2017.
- Gillis, J. “Warfighter Trust in Autonomy.” DSIAC Journal, vol. 4, no. 4, pp. 23–29, Fall 2017.
- Defense Science Board. “Seven Defense Priorities for the New Administration, Chapter Five: Anticipating Intelligent Systems and Autonomy.” Ch. 5, pp. 46–52, December 2016.
- U.S. Department of Defense. “2016 Operational Energy Strategy,” 2016.
- Brown, W. C. “Experiments Involving a Microwave Beam to Power and Position a Helicopter.” Trans. IEEE Aerosp. Electron. Syst., vol. 5, no. 5, pp. 692–702, September 1969.
- Strassner, S., and K. Chang. “Microwave Power Trans-mission: Historical Milestones and System Components.” Proc. IEEE, vol. 101, no. 6, June 2013.
- Bergsrud, C., and A. Zellner. “Dynamic Wireless Power/Energy Transfer System Apparatus Modeling and Simulation (M&S), Analysis, and Visualization (MSAV) Systems Along with Related Methods.” U.S. Patent Application No. 15/917,248, filed 9 March 2018.
- Radiocommunication Sector of the International Tele-communication Union. Recommendation ITU-R P.676-11: Attenuation by Atmospheric Gases, September 2016.
- Earth System Research Laboratory. “Monthly/Seasonal Climate Composites.” National Oceanic & Atmospheric Administration, https://www.esrl.noaa.gov/psd/cgi-bin/data/composites/printpage.pl, accessed 5 November 2018.
- Brown, W. C. “Electronic and Mechanical Improvement of the Receiving Terminal of a Free-Space Microwave Power Transmission System.” Tech. Rep. PT-4964 and NASA Rep. CR-135194, Raytheon Company, MA, August 1977.
- McSpadden, J. O., L. Fan, and K. Chang. “Design and Experiments of a High-Conversion-Efficiency 5.8-GHz Rectenna.” IEEE Trans. MTT, vol. 46, no. 12, pp. 2053–2060, December 1998.
- Koert, P., J. Cha, and M. Macina. “35 and 94 GHz Rectifying Antenna Systems.” In SPS 91-Power From Space Dig., Paris, France, pp. 541–547, August 1991.
- Lee, C. “Army to Pursue ‘With Urgency’ Autonomous Systems Strategy.” National Defense Magazine, pp. 36–37, June 2018.