Background
Reliability is the probability that an item will perform its intended function for a specified period under stated conditions. It has a significant impact on operating and sustainment costs within the U.S. Department of Defense (DoD), which typically represent 70% of the program’s total life-cycle costs [1]. System reliability also directly affects system availability and life-cycle costs since a system with poor reliability may require an increase in maintenance labor, repair material, and spares. Thus, improving reliability can result in significant savings in the support costs for any major weapon system.
Reliability growth is the improvement in reliability over time due to improvements in the product’s design or the manufacturing process [2]. Reliability growth consists of two main areas—planning and assessment. Reliability growth assessment uses data from testing to estimate the improvement in reliability, and it can be further broken down into reliability growth tracking and projection. Reliability growth planning uses assessment model forms, along with various management metrics, to provide a plan for improving reliability prior to any testing. DAC developed reliability growth planning and assessment models, which can assist program managers in meeting the system reliability requirements and generate reliability growth curves for planning, tracking, and projection. In addition to providing reliability models, DAC also provides analytic support to defense programs and helps develop reliability-related policy, guidance, standards, methods, and training.
RelTools Dashboard
DAC, formally known as the U.S. Army Materiel Systems Analysis Activity (AMSAA), initially developed a collection of key reliability models and tools in Microsoft Excel and distributed them upon request to U.S. government personnel and their DoD contractors. The collection has been improved and modernized by coding the models in the programming language R and wrapping them in a Shiny app. The brand-new, highly interactive container for the models and tools is called the RelTools Dashboard (shown in Figure 1). The dashboard contains a wide range of models for reliability growth planning, tracking, and projection as well as tools for test planning and quick requirements calculations. It also hosts a downloadable Reliability Scorecard, which aids in assessing the reliability risks of a developmental acquisition program. As seen in Figure 1, the models are listed in the sidebar on the left-hand side and broken down by category. The dashboard can be accessed on the Web by a uniform resource locator [3] and is available free of charge to U.S. government personnel and DoD contractors. The only requirements for access are a government network connection and a common access card.
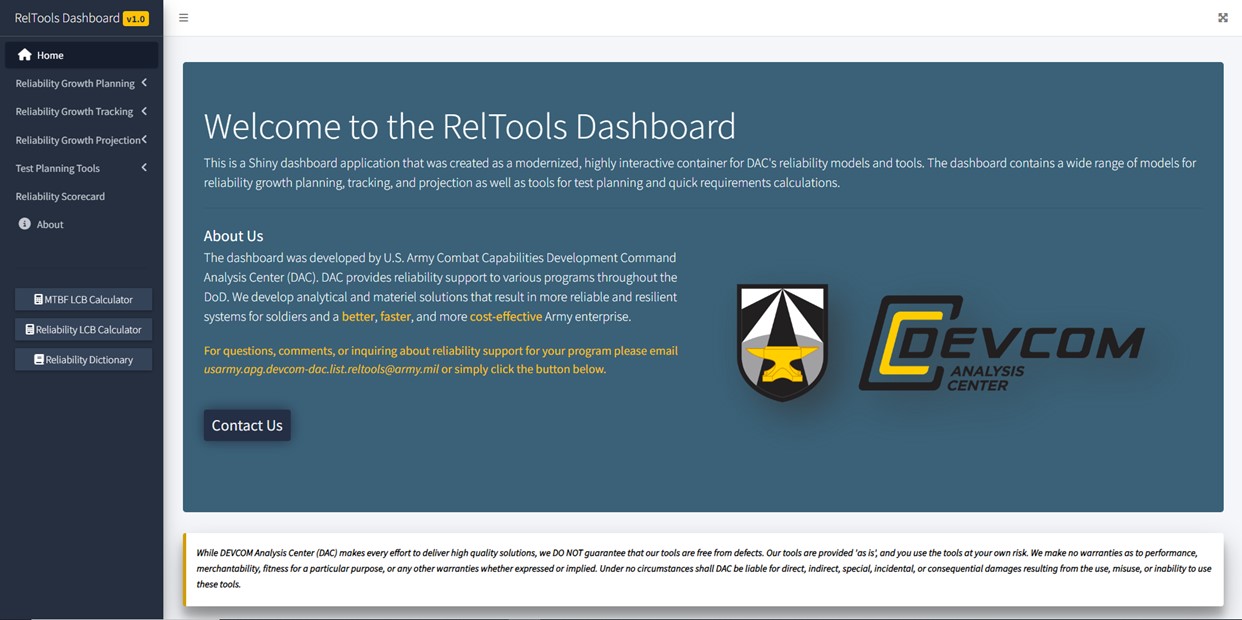
Figure 1. RelTools Dashboard Home Page (Source: DAC).
Reliability Test Planning
When choosing the duration for reliability demonstration during an initial operational test (IOT), it is critical for program managers to consider the reliability requirement and the desired confidence level and probability of acceptance. To aid in this process, two reliability test planning tools are available: (1) the IOT Planning Tool – Continuous (IPT-C), which is for continuous-use systems, and (2) the IOT Planning Tool – Discrete (IPT-D), which is for discrete-use systems. A continuous-use system refers to systems where usage is measured on a continuous scale, such as hours, miles, etc. A discrete-use system refers to a system where usage is measured in terms of discrete trials, such as shots from guns, rockets, or missile systems. Both IPT-C and IPT-D allow program management to effectively plan for a fixed-length, fixed-configuration demonstration test, such as the IOT. These tools are located in the Test Planning Tools tab of the RelTools Dashboard. Screenshots from the IPT-C are shown in Figure 2.
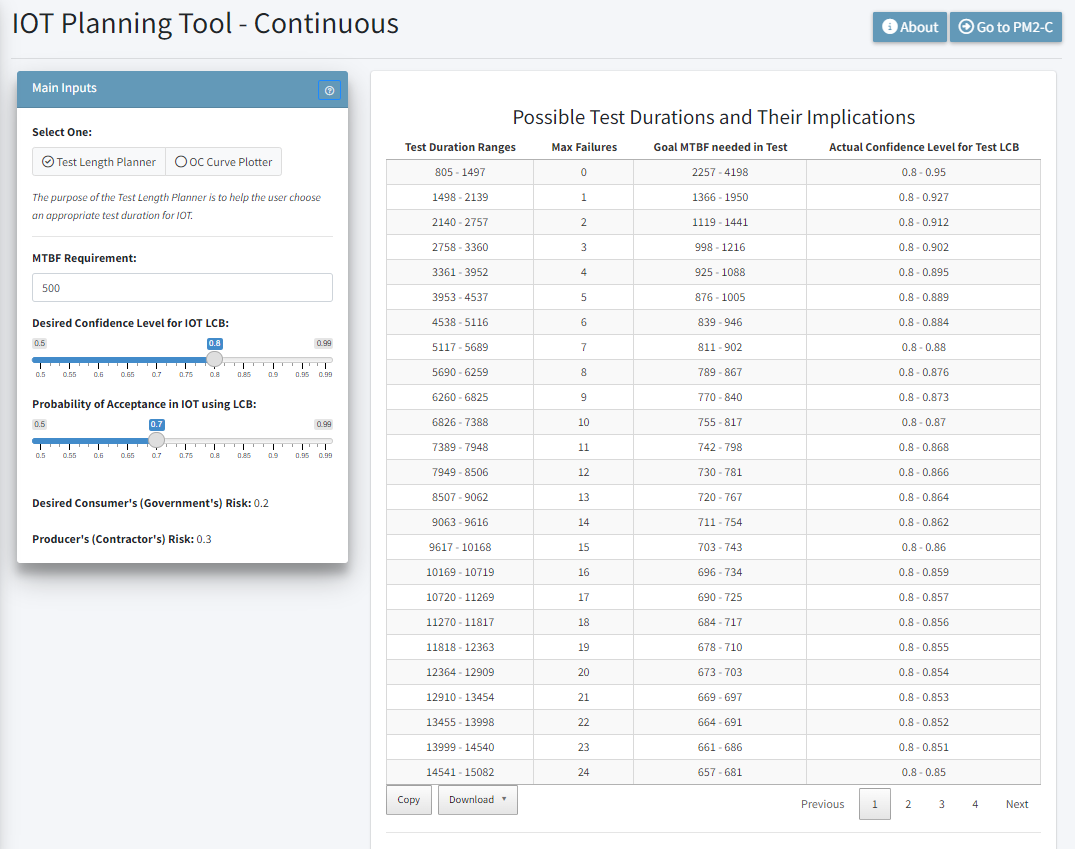
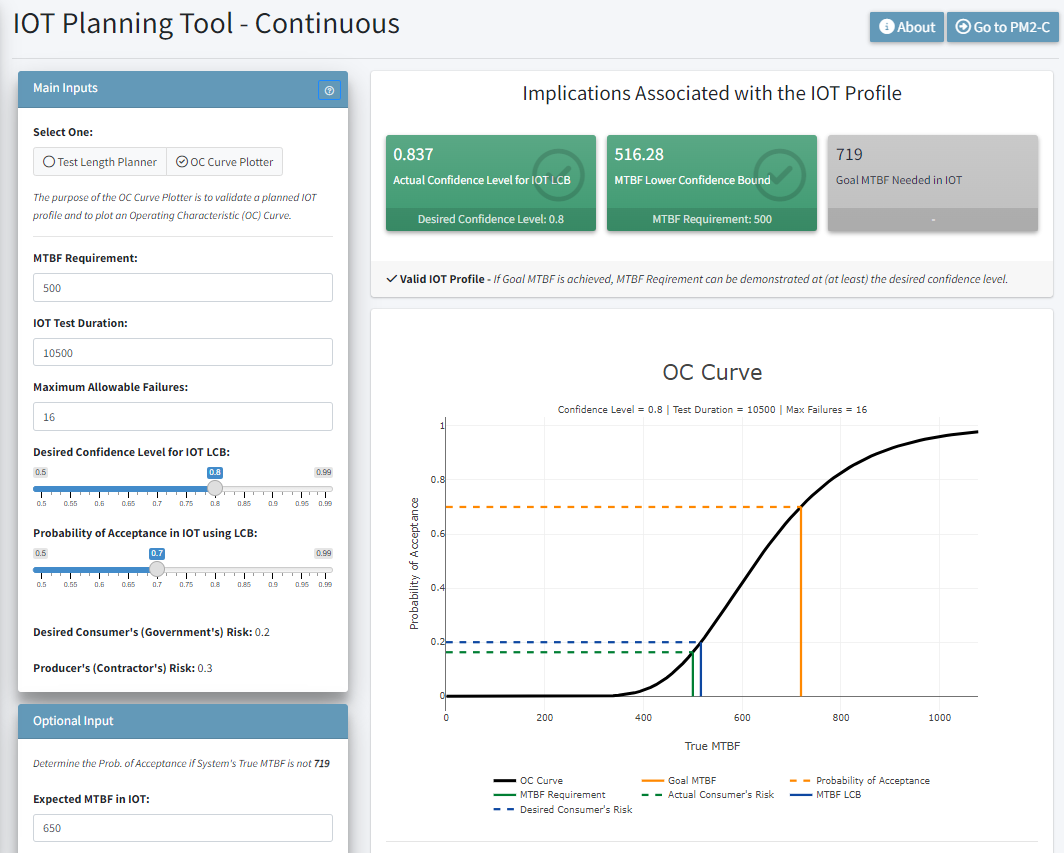
Figure 2. IPT-C Example (Source: DAC).
The purpose of the IPT-C and IPT-D is to help the user choose an appropriate IOT profile to aid in developing a reliability program plan. Both IPT models contain two tools—a Test Length Planner and Operating Characteristic (OC) Curve Plotter. Their only difference is in the calculations used for the specific type of systems they cover. The Test Length Planner, shown on the left in Figure 2, displays possible IOT test durations based on the mean time between failure (MTBF) requirement, desired confidence level, and probability of acceptance. The OC Curve Plotter, shown on the right in Figure 2, is used to validate a planned IOT profile and plot an OC curve. The OC curve shows how the true underlying reliability of the system impacts the probability of successfully passing the demonstration test. Together, these tools can aid in conducting trade-off analyses involving the reliability demonstration test lengths, reliability requirements, and the associated statistical risks when planning reliability demonstration tests.
Reliability Growth Planning
Reliability growth occurs by identifying failure modes and developing corrective actions to mitigate the failure modes. Reliability Growth Planning Curves (RGPCs) assist program managers in managing this process by determining program schedules, allocating resources, and defining the realism of the test program in achieving the required reliability. The planning curve is constructed early in the program’s life cycle when little-to-no reliability data is available, and it provides an indication of the reliability that can be expected during different stages of the program’s development. The planned reliability values in the planning curve serve as a basis for evaluating future reliability growth progress during reliability growth testing. An example of a RGPC is shown in Figure 3. The idealized curve, shown in black, portrays the expected overall reliability growth pattern across test phases. Since failure modes are not found and corrected instantaneously during testing, the RGPC uses a series of MTBF targets to represent the actual MTBF goals for the system during each test phase throughout the test program [2]. These are represented by the sequence of colored steps in the plot. The end of the planning curve depicts the reliability target necessary to successfully demonstrate the reliability requirement in a reliability demonstration test. This target can be found using the IPT-C previously discussed.
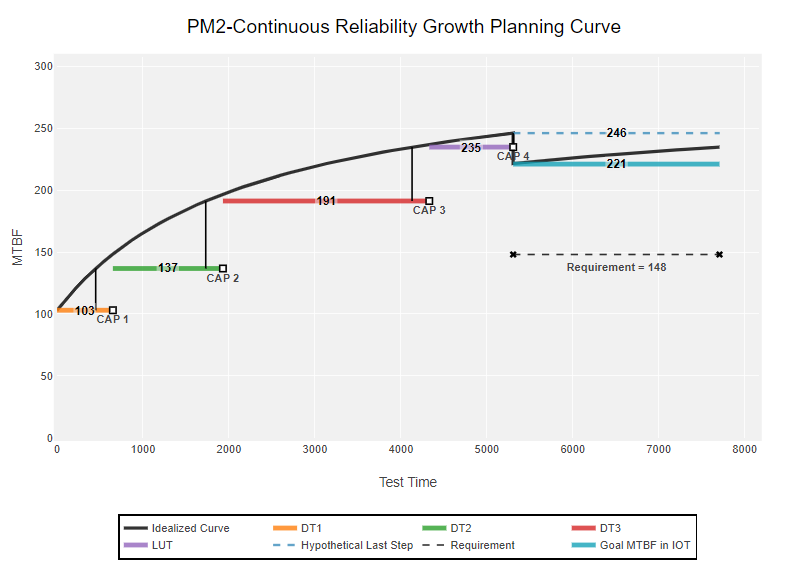
Figure 3. Example of Reliability Growth Planning Curve (Source: DAC).
Reliability growth planning should consider the initial and goal reliability targets, test phases, corrective action periods, and reliability thresholds (interim goals to be achieved following corrective action periods). Reliability growth planning should also include realistic management metrics, such as management strategy (MS) and fix effectiveness factors (FEFs). MS is the assumed proportion of the initial failure rate that will be addressed via corrective action during the test-fix-test process. FEF is the fractional reduction in the failure rate for a failure mode after a corrective action is applied [2].
The RGPC should be developed using reliability growth planning models, such as the Planning Model Based on Projection Methodology (PM2)-Continuous (PM2-C) or PM2-Discrete (PM2-D). The purpose of PM2-C and PM2-D is to aid in constructing a reliability growth planning curve (similar to Figure 3) over a developmental test (DT) program useful to program management. It serves as a baseline against which reliability assessments can be compared and can highlight the need to management when reallocation of resources is necessary. Both models are found under the Reliability Growth Planning tab of the RelTools Dashboard, and screenshots of the main inputs of these models are shown in Figures 4 and 5. The main inputs are broken down in a series of steps and include the following:
- MTBF or reliability requirement
- Confidence level
- Probability of acceptance
- IOT test duration or number of trials
- Assumed DT to IOT degradation factor
- Initial MTBF or reliability
- MS
- Average FEF
- DT schedule
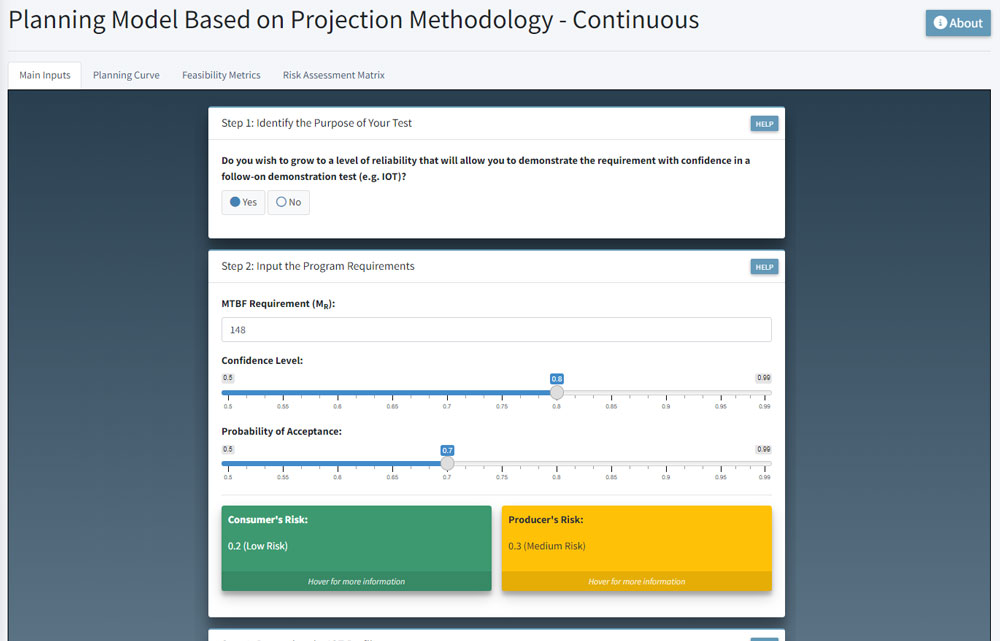
Figure 4. PM2-C Main Inputs (Source: DEVCOM Analysis Center).
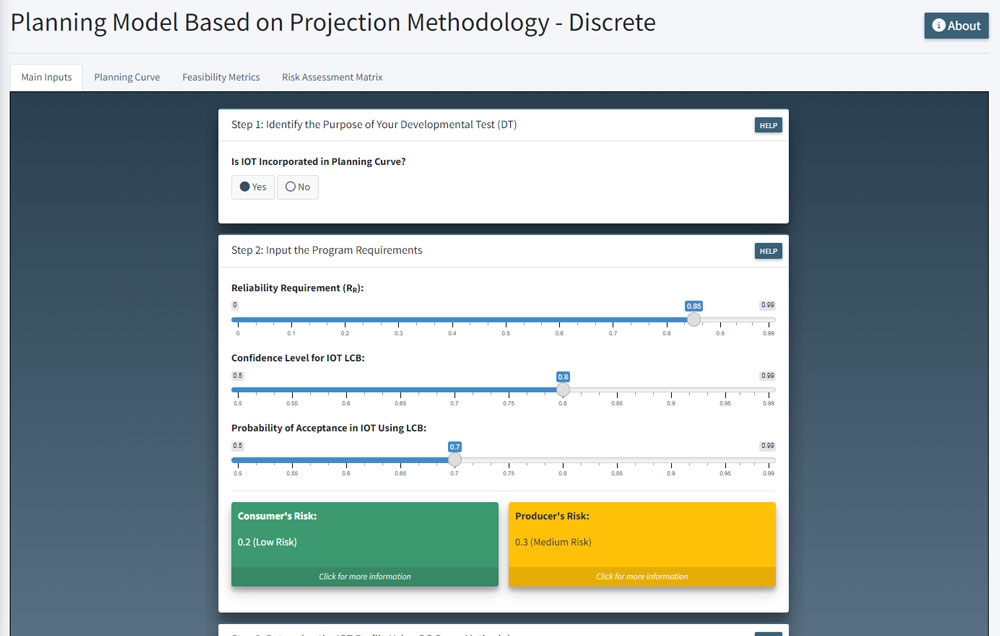
Figure 5. PM2-D Main Inputs (Source: DAC).
Reliability Growth Tracking
Reliability Growth Tracking models estimate the reliability of a system in a DT program by evaluating the reliability growth that results from incorporating design and quality fixes into the system during a test event. The purpose of reliability growth tracking is to determine the amount of reliability growth occurring during the test and estimate the demonstrated reliability at the end of the test phase. This assists management in determining if the program is progressing as planned, better than planned, or not as well as planned. When a program is not progressing as planned, a new reliability strategy may need to be developed. Reliability growth tracking provides a statistical estimate of the system reliability at a given time based on observed test data. Tracking models should be used to update a system’s reliability based on actual test data.
The Reliability Growth Tracking Model for Continuous data (RGTMC) is a tool for assessing the improvement (growth) in the system’s reliability, within a single test phase during development, for which usage is continuously measured. This model is useful for monitoring a system’s reliability in a DT program by evaluating the reliability growth resulting from incorporating design and quality fixes into the system during the test program. The model may utilize data when exact failure times are known, along with data when failure times are only known to an interval (grouped data).
RGTMC is found under the Reliability Growth Tracking tab of the RelTools Dashboard, and a screenshot of the model is shown in Figure 6. The figure depicts the model after main inputs have been entered and calculations have been performed. The left-hand side shows the inputs that were entered into the model, including total test time, total number of failures, and failure occurrence times. The right-hand side shows an example of the expected vs. observed number of failures plot generated by RGTMC, which can be used to determine how well the model fits the data. Additional model output, such as the estimated MTBF at the end of the test, is available in the tabs on the top right of the screen.
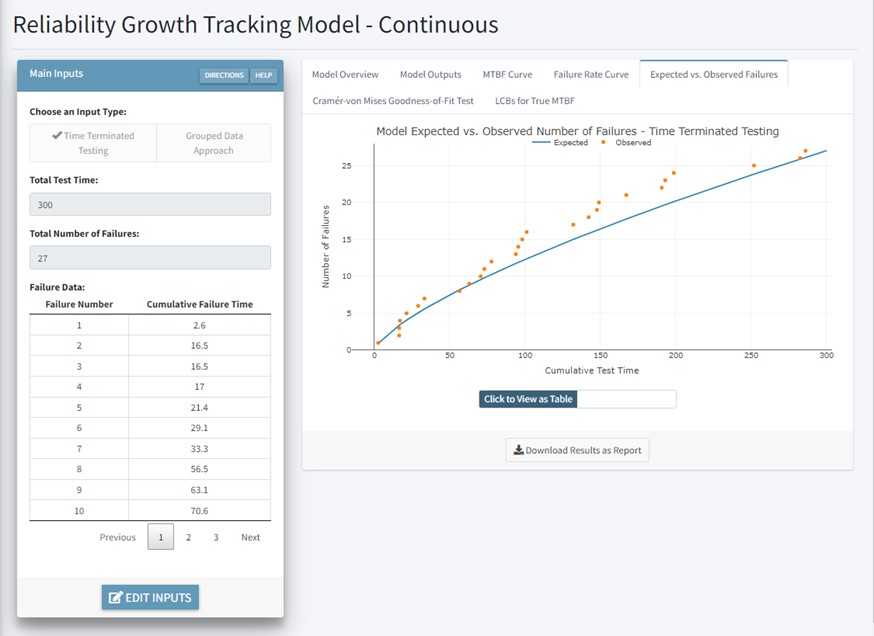
Figure 6. RGTM-C Example (Source: DAC).
Reliability Growth Projection
Reliability growth projection is an additional approach for determining if a program is on track to meeting its reliability requirements. Reliability Growth Projection models provide an estimate of the reliability at a current or future milestone based on planned and/or implemented fixes, assessed fix effectiveness, and a statistical estimate of the problem mode rates of occurrence. Projections determine the system’s reliability before and after corrective actions have been implemented, including future delayed, corrective actions. These results can be used to help program managers decide how to allocate resources prior to entering the next test phase. When a program is experiencing reliability problems, projections can be used to investigate alternative test plans. This can be done using either the AMSAA Maturity Projection Model (AMPM) [4] or the AMSAA Discrete Projection Model (ADPM) [5], which can be found in the Reliability Growth Projection tab of the RelTools Dashboard.
The purpose of the AMPM is to provide an estimate of the projected reliability following the implementation of both delayed and nondelayed fixes for continuous systems. The model also provides estimates of the following important reliability growth metrics:
- Initial failure intensity
- Growth potential failure intensity
- Expected number of failure modes surfaced
- Percent of the initial failure intensity surfaced
- Rate of occurrence of new failure modes
The purpose of the ADPM is to provide an estimate of the projected reliability following the implementation of both delayed and nondelayed fixes for discrete systems. The model also provides estimates of the following important reliability growth metrics:
- Reliability growth potential
- Expected number of failure modes surfaced
- Probability of a new failure mode occurring
- Fraction surface of the system’s initial probability of failure
Screenshots from AMPM and ADPM are shown in Figures 7 and 8, respectively. These figures depict both models after main inputs have been entered and calculations have been performed. In Figure 7, the left-hand side shows the inputs that were entered into the model, and the right-hand side shows the observed failure modes vs. the prior predicted, cumulative number of failure modes plot. In Figure 8, the left-hand side shows the inputs that were entered into the model, and the right-hand side shows the observed vs. expected number of failure modes plot.
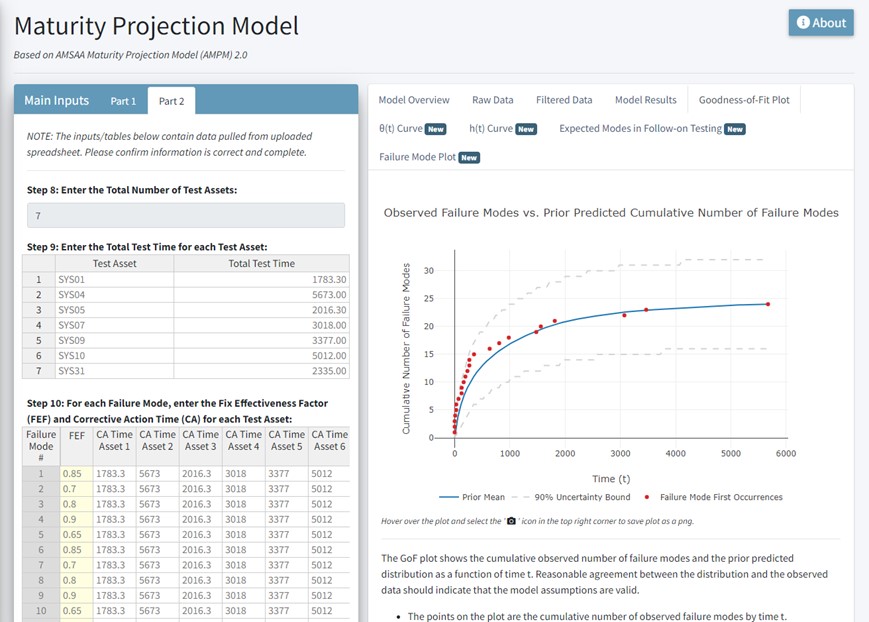
Figure 7. AMPM Example (Source: DAC).
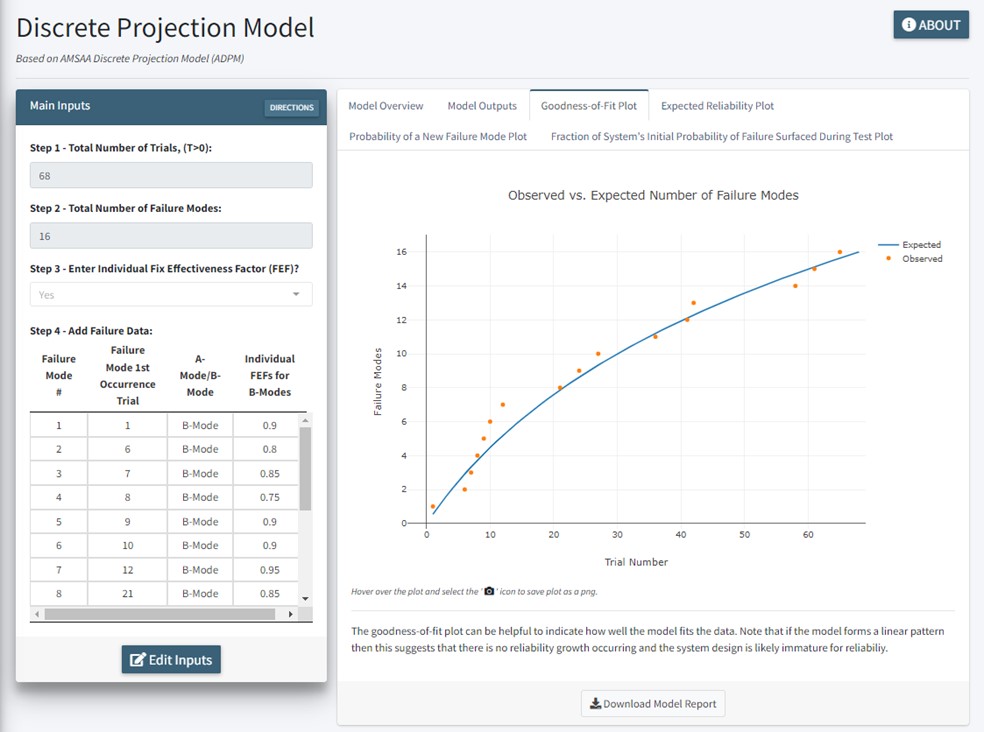
Figure 8. AMPM Example (Source: DAC).
Reliability Scorecard
In addition to reliability growth models and test planning tools, the RelTools Dashboard also contains the DAC Reliability Scorecard. This scorecard replaces the AMSAA Reliability Scorecard [6] and AMSAA Software Reliability Scorecard [7]. The purpose of the DAC Reliability Scorecard is to evaluate a program’s planned and completed reliability activities. This is to ensure reliability best practices are being implemented while also identifying areas that may need improvement. It can be applied to a program at any phase in the acquisition life cycle and to systems that are hardware-intensive, software-intensive, or a combination of both. The Scorecard can be found in the Reliability Scorecard tab and is available as a downloadable Excel file to be used separately from the Dashboard itself. The spreadsheet consists of the following eight categories:
- Program Plan and Schedule
- Develop and Design Team
- Requirements and Goals
- Design Process and Considerations
- Modeling and Analysis
- Testing
- Supply Chain
- Fielding and Sustainment
These eight categories contain one or more elements, resulting in 32 total elements. Based on the rating criteria associated with each element, the user will assign each element one of the following ratings from a drop-down list: Not Achieved, Partially Achieved/Needs Improvement, Fully Achieved, or Not Applicable. Once all elements are rated, the scorecard generates a summary of the scorecard ratings, which can assess the adequacy of a reliability program and highlight the areas that require improvement.
Conclusions
System reliability is a key component of maximizing system availability and minimizing life-cycle costs. Overall, an improvement in reliability can result in significant savings in the support costs for any major weapon system. The models and tools available in the RelTools Dashboard can be used to improve reliability by assisting management in meeting system reliability requirements. To access the RelTools Dashboard, go to https://apps.dse.futures.army.mil/RelToolsDashboard/. For any questions about the dashboard or any of the models, please contact usarmy.apg.devcom-dac.list.reltools@army.mil.
References
- U.S. Government Accountability Office (GAO). “Weapon System Sustainment: Selected Air Force and Navy Aircraft Generally Have Not Met Availability Goals, and DoD and Navy Guidance Need to Be Clarified.” GAO-18-678, Washington, D.C., 10 September 2018.
- U.S. Army Materiel Systems Analysis Activity. “MILHDBK-189C: Reliability Growth Management.” Aberdeen Proving Ground, MD, 14 June 2011.
- DEVCOM Analysis Center. “RelTools Dashboard.” https://apps.dse.futures.army.mil/RelToolsDashboard, 26 October 2022.
- Wayne, M., and M. Modarres. “A Bayesian Model for Complex System Reliability Growth Under Arbitrary Corrective Actions.” IEEE Transactions on Reliability, vol. 64, no. 1, pp. 206–220, doi: 10.1109/TR.2014.2337072, March 2015.
- Hall, J. B., P. M. Ellner, and A. Mosleh. “Reliability Growth Management Metrics and Statistical Methods for Discrete-Use Systems.” Technometrics, vol. 52, no. 4, pp. 379–389, doi: 10.1198/tech.2010.08068, 2010.
- Shepler, M. H., and N. Welliver. “New Army and DoD Reliability Scorecard.” Proceedings – Annual Reliability and Maintainability Symposium (RAMS), San Jose, CA, pp. 1–5, doi: 10.1109/RAMS.2010.5448062, 2010.
- Bernreuther, D., and T. Pohland. “Improved Software Reliability by Application of Scorecard Reviews.” The 2013 Proceedings Annual Reliability and Maintainability Symposium (RAMS), Orlando, FL, pp. 1–5, doi: 10.1109/RAMS.2013.6517767, 2013.
Biography
Melanie Goldman is a member of the Center for Reliability Growth Team at DAC. She holds a bachelor’s degree in mathematics from the University of Delaware and is currently pursuing her master’s degree in applied and computational mathematics from Johns Hopkins University.


