


SUMMARY
Many advanced engine system designs result in significant increases in operating temperatures, which, in turn, require new thermal protection coatings (TBCs). In addition to providing a much higher level of thermal protection, TBCs must have sufficient strength at these higher operating temperatures to avoid spallation or other structural failure. Advanced TBCs are often made from ceramics because of its high melting temperature, durability, and relative ease of application. In this work, the relationship between material microstructure and performance of ceramic coatings is identified through computational approach. All work used yttria-stabilized zirconia (YSZ) as a model material, but the approach can be applied to many different ceramic materials.
INTRODUCTION
Advances in engine design have led to the need for additional thermal protection for engine components. It is not unreasonable to expect that the next generation of TBCs must provide at least 1 to 2 orders of magnitude increase in thermal protection over existing coating technologies. To design an effective coating, it is important to realize that TBCs are not single-purpose materials. In addition to providing thermal protection, a TBC must withstand high temperatures and structural loads without failure. Structural failure of TBCs is often simply not acceptable. For instance, coating spallation on turbine blades can result in severe engine damage from TBC coating debris entering the engine.
Obtaining increased thermal protection and sufficient strength at higher temperatures can be problematic. Increased porosity, a commonly used feature to decrease thermal conductivity, is also known to decrease mechanical strength, increasing the risk of structural failure. Reducing grain size, however, decreases thermal conductivity and increases mechanical strength. Computational modeling can be used to design ceramic coatings that balance features, such as porosity and grain size, by quickly evaluating thermal performance and structural strength.
In this article, we review use of computational simulations to evaluate using porosity in a ceramic TBC for sufficient thermal and structural performance. We will first introduce the material characteristics of interest and our modeling process. We will then present initial model validation through direct comparison with experimental results. Next, trends in performance identified via a series of computational simulations will be presented. Finally, we end with a few words addressing future plans.
MATERIAL CHARACTERISTICS
In order for computational modeling to be meaningful, the model must include a reasonably-accurate constitutive response and accurate geometric representation of pertinent features. In the current work, the baseline material used for all studies is YSZ, a well-characterized, ceramic TBC. YSZ bulk material structural properties are readily available in the literature.
Capturing appropriately-sized features is more challenging. In this case, the limitation is not the smallest dimension that can be incorporated into a computational model but rather the smallest grain size that can be fabricated. This smallest grain size will dictate the size of porosity that we can incorporate into the TBC. Developing sintering processes minimizing grain growth is a major challenge for ceramics since grain growth in ceramics tends to occur at the same temperatures required for sintering.
The U.S. Naval Research Laboratory (NRL) has the ability to create nanograined ceramic materials. Gorzkowski et al. [1] successfully limited grain growth in a ceramic through a two-step sintering process, which paired a short-duration, high-temperature heating stage to isolate any porosity with a long time step at a lower temperature to achieve final densification. Thermal diffusivity decreased ~30% when this process was applied to nanosized YSZ powder (100-nm grain size) with random nanoscale pores [1, 2].
Now that we know we can create a ceramic with a small-scale porosity, we need to develop an understanding of the geometric and spatial characteristics of porosity. Nakamura et al. [3] examined porosity by using a regular array of defects with random size, shape, and orientation identifying the relationship between measured strength and defect size. Wang et al. [4] and Kulkarni et al. [5] quantified real porosity patterns from scanning electron microscope images for coatings generated by various techniques. Amsellem et al. [6, 7] focused on image reconstruction highlighting the importance of three-dimensional (3-D) features in calculating effective moduli. Cronin et al. [8] used 3-D images to identify and include grain boundaries in their finite-element (FE) models as critical features relating to thermal performance. In contrast to using full 3-D characteristics of porosity, Wei et al. [9] demonstrated through simplified modeling that the largest defect was the most important factor in determining the effective thermal conductivity.
All of these studies provide insight, but many lacked details on porosity characteristics which could be used to further evaluate the characteristic-performance relationship. However, Wang et al. [4] provided geometric and statistical information on porosity characteristics. Porosity was defined by three types of defects—voids, pores, and cracks. Each defect category be represented by a two-dimensional (2-D) ellipse or a 3-D ellipsoid. In two dimensions, voids are spheres (equal minor and major axes), pores are oblate ellipses, and cracks are flattened ellipses (minor axes are much less than major axes). We used this data to define the baseline porosity condition examined and included variations in defect shape, size, and orientation. We also created a 3-D representation of porosity by defining the third axis as equal to the 2-D minor axis. Our matrix of porosity definitions allowed us to develop an understanding of how defect shape, size, orientation, and the amount of porosity present impact TBC performance.
COMPUTATIONAL MODELS
Thermal and structural performance was evaluated by FE techniques for a range of porosity level, defect sizes, and spatial orientations. All of the porosity geometries considered were feasible based on NRL’s successful fabrication of nanograined ceramics. The baseline material was fully-dense YSZ, with a thermal conductivity of 2.5 W/mK and Young’s modulus of 200 GPa. Linear material response was utilized in all analyses.
A commercial FE code [10] was used for all analyses, which were run on U.S. Department of Defense (DoD) high-performance computing (HPC) facilities. The 2-D model represented a surface area coating of 30 x 50 µm and unit thickness. The 3-D models had a thickness of 5 µm, resulting in a volume of 30 x 50 x 5 µm. This thickness was chosen to allow 3-D effects while creating a model that was not too large to solve on available computer resources. Two-dimensional models consisted of ~300,000 elements and ran in less than an hour. The 3-D models had between 7 and 9 million elements, depending on the porosity level, and ran in less than 10 hr.
Two-Dimensional Models
Multiple 2-D models were created to evaluate defect size, number, and orientation [11]. Defect dimensions were based on measured data [3]. The baseline 2-D model had 600 defects distributed between voids, pores, and cracks (as shown in Table 1). In addition, defect size and orientation within the plane varied. A typical defect pattern is shown in Figure 1.
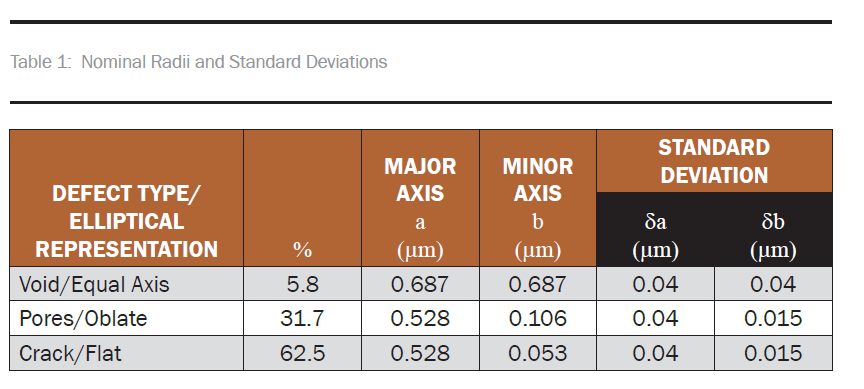
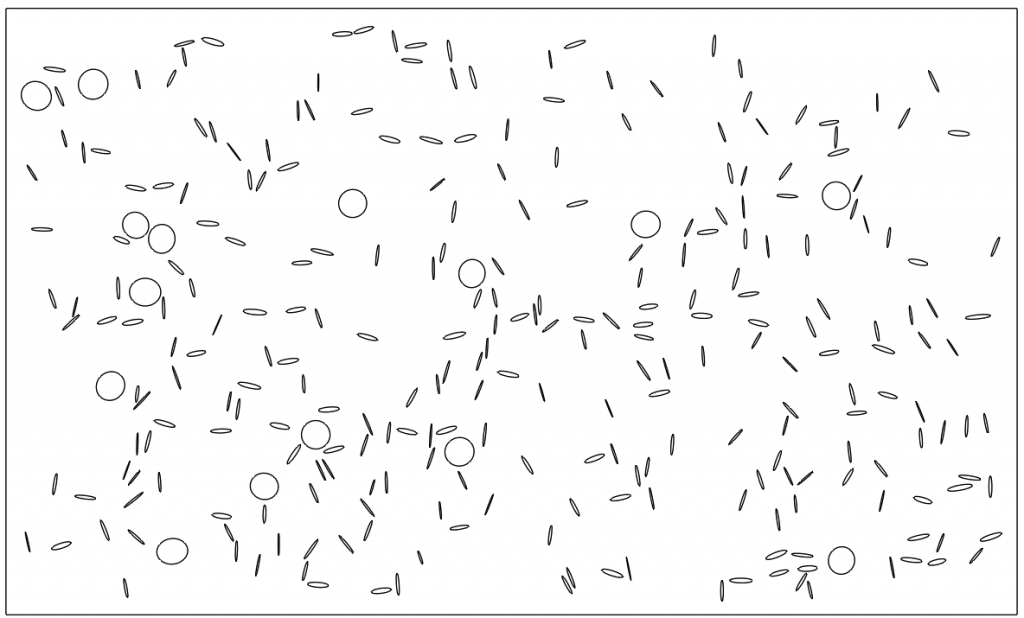
Figure 1: Geometry for the 2-D Model With 3.5% Porosity (Source: NRL).

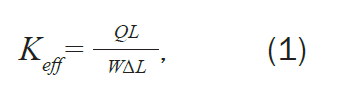
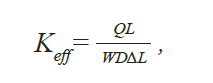
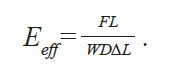
Performance is evaluated by effective thermal and strength properties as defined by equations (1) and (2):
![]()
and

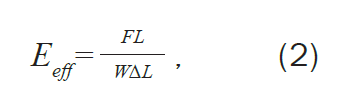
where Keff and Eeff are the effective thermal conductivity and effective elastic modulus. For vertical loading (either temperature difference or displacement), L is the height, W is the width, and ΔT is the temperature difference between the top and bottom edges. ΔL is the displacement of the top edge, Q is the sum of reaction heat flux at the node points along the bottom edge, and F is the sum of reaction forces at the node points along the bottom edge. For horizontal loading (horizontal temperature difference or displacement), the L and W change places in the equations, the ΔT and ΔL are measured horizontally, and Q and F are summed along the left-hand side.
Three-Dimensional Models
While performance trends and other information can be inferred from 2-D simulations, results have to be critically evaluated since the 3-D nature of the material is not incorporated into the analysis. The 3-D computational modeling is addressed by Wimmer et al. [12, 13]. A typical 3-D porosity model is shown in Figure 2, as well as representative porosity patterns through the thickness. Examination of the variation in porosity at any cross section highlights the inherent 3-D nature of the material.
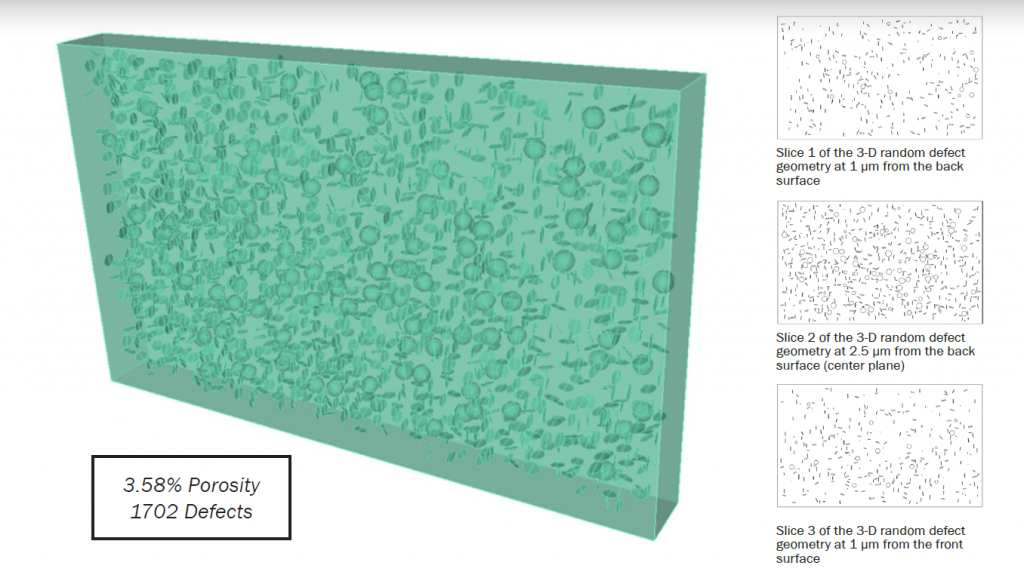
Figure 2: Geometry for the 3-D Model, With 3.58% Porosity and Typical Through Thickness Slices Showing Variations in Local Porosity (Source: NRL).
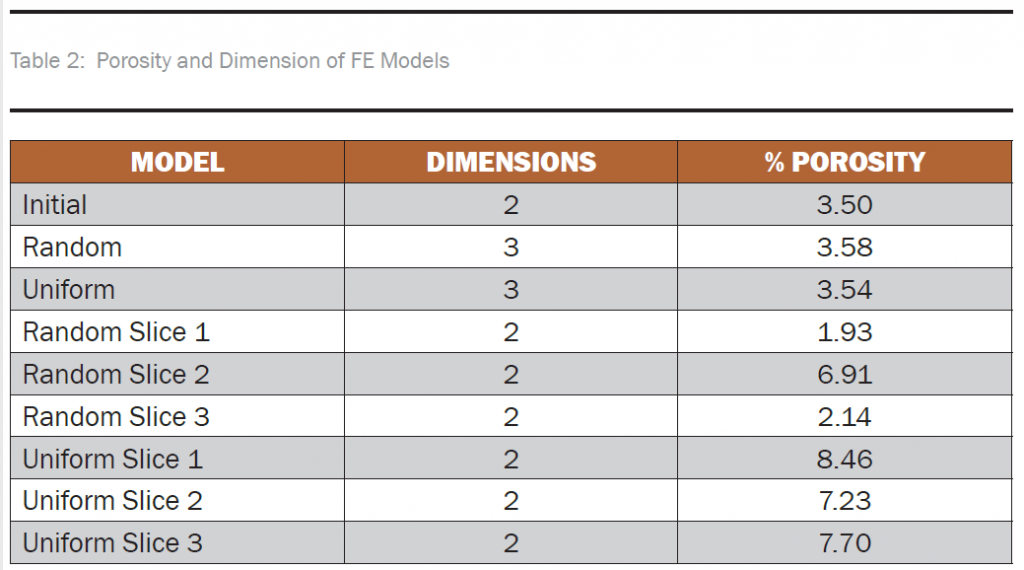
Typical variations in localized porosity are shown in Table 2. Large differences in local porosity may occur; for instance, a TBC with 3.54% porosity may have regions with localized porosity level ranging from 1.93% to 6.91%. Calculated effective properties will vary based on the local porosity level.

Effective material properties for the 3-D models are calculated by including the thickness (D) in equations (3) and (4):
![]()
 (3)
(3)
and

 (4)
(4)
MODEL VALIDATION
Model validation is a critical step in any computational effort. The fundamental question in the validation process is how well does the model represent reality? Once confidence is gained through validation, additional “what if” scenarios can be undertaken.
NRL successfully fabricated YSZ based ceramics with specific porosity levels (Figure 3), as fabricated ceramics were close to single-defect porosity conditions [13]. Thermal diffusivity and heat capacity were measured, and effective thermal conductivity was calculated. Effective elastic moduli were calculated from measured indentation hardness values.
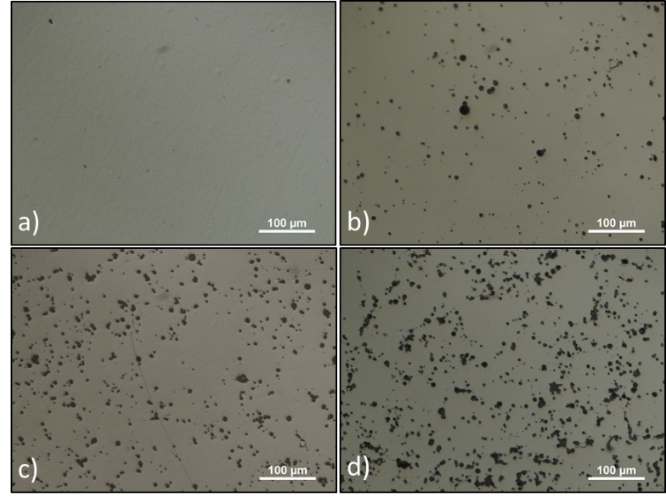
Figure 3: Representative Optical Microscope Images of Sample Surfaces With a) <0.01%, b) 4%, c) 7%, and d) 9% Porosities (Source: NRL).
Validation results used all 2-D and 3-D calculated values. In addition to models with multiple types and sizes of defects, we examined the impact of porosity made up of only one type of defect—spherical voids [13]. This defect geometry was created specifically to mimic the creation of a TBC using spherical sacrificial material (i.e., material which will disintegrate during the sintering process).
Effective thermal conductivity vs. porosity values are shown in Figure 4. As expected, the effective conductivity decreases with increasing porosity. The 3-D model shows effective values ~10% greater than 2-D values. The measured conductivity is between the calculated effective conductivity from the 3-D and 2-D models showing a variation of less than 10% between computational and experimental results. Single-defect porosity calculated values fall within the general performance trend defined by all calculated values.
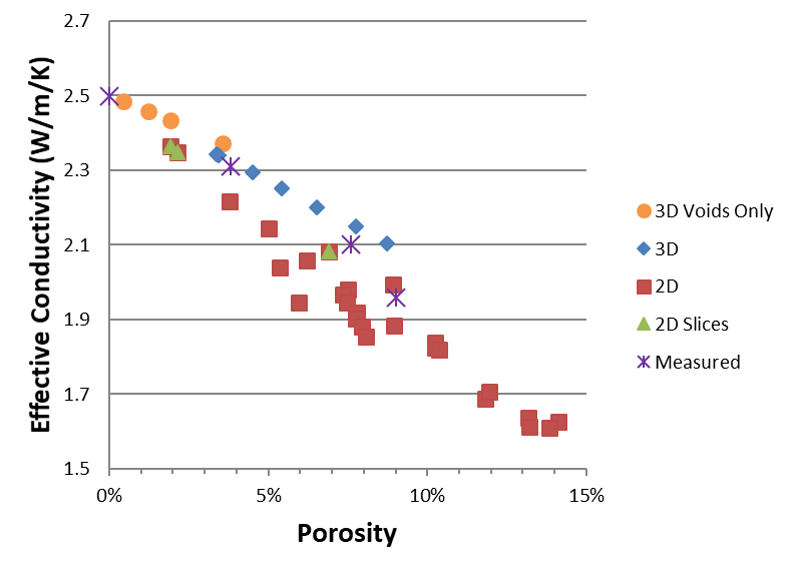
Figure 4: Effective Thermal Conductivity vs. Porosity for a Vertical Thermal Gradient (Source: NRL).
Figure 5 shows the effective elastic moduli for vertical loading. As expected, the effective moduli decreases with increasing porosity. Measured moduli are higher than computational values, with the 3-D results closer to measured values. Once again, single-defect porosity computational results follow the same performance trends as all other computational porosity patterns.
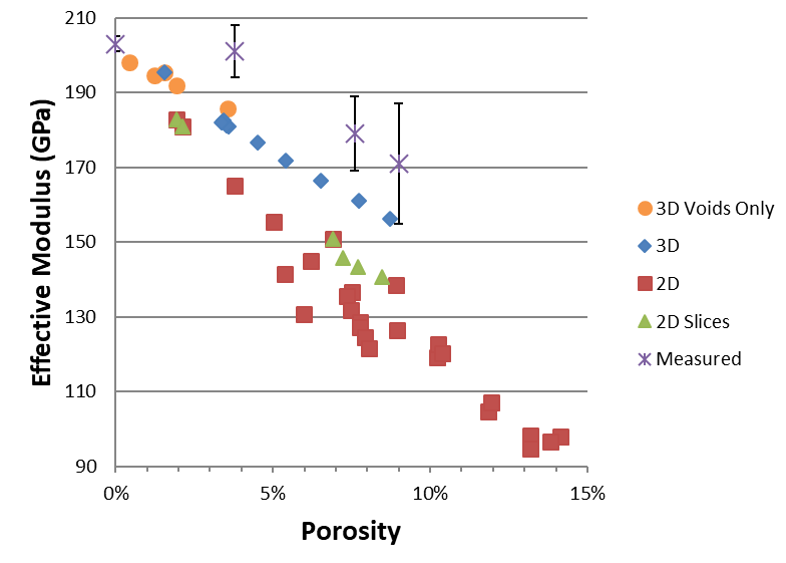
Figure 5: Effective Young’s Modulus vs. Porosity for a Vertical Thermal Gradient (Source: NRL).
Initial comparisons are very good. While additional work is needed to improve computational-experimental validation metrics, this is a good start, and it is reasonable to discuss computational trends based on this level of agreement.
PERFORMANCE TRENDS
Computational modeling provides insight on how specific porosity characteristics affect performance. Horizontal chaining of heat flux is desirable in TBCs to block heat transfer across the coating. However, chaining stress values is undesirable since it leads to connecting regions of localized failure and creates percolation of material separation across the thickness. Ultimately, this can lead to percolation of material separation and spallation along high-stress seams. The general trend is for the effective structural modulus to decrease with increasing porosity. However, variations in structural and thermal performance can be observed, with variations in defect geometries. Variations in porosity resulted in the greatest changes in effective performance metrics. Variations in thermal and structure results due to variations in pore lengths are shown in Figure 6.
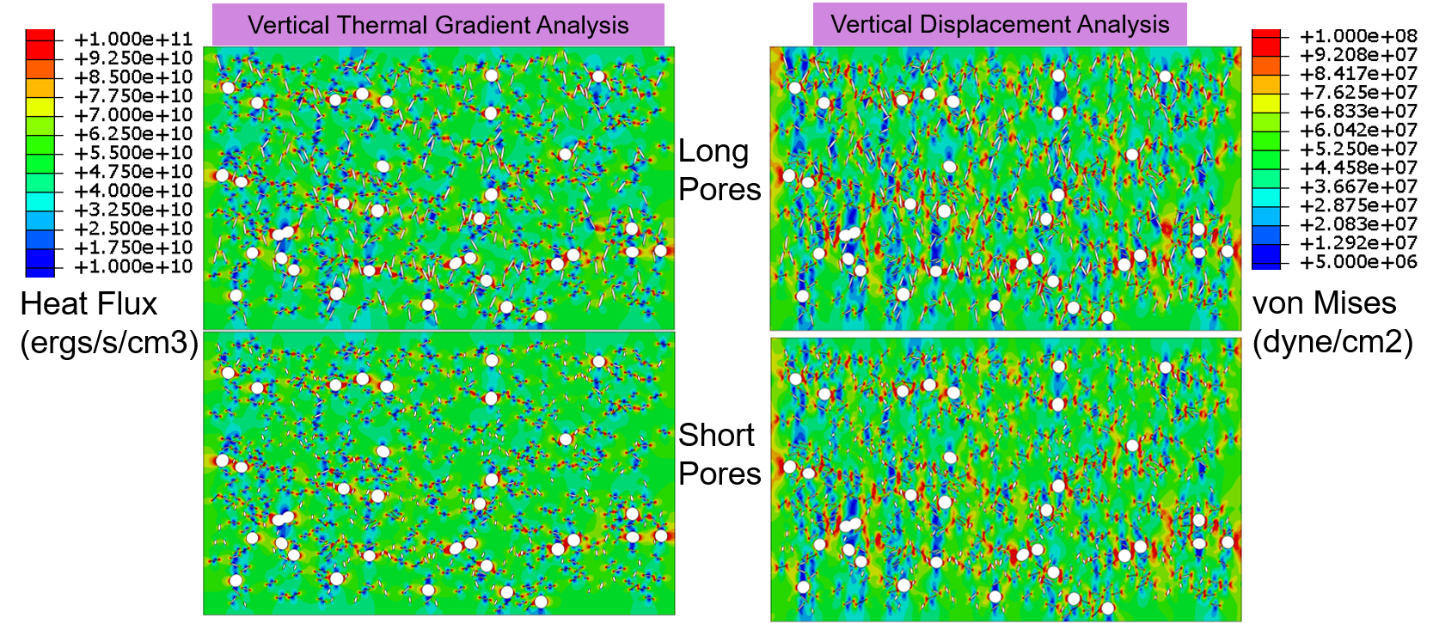
Figure 6: Contour Plots of Heat Flux (ergs/s/cm3) and von Mises Stress (dyne/cm2) Showing Variations From Changes in Pore Geometries (Source: NRL).
Three-dimensional FE studies [12, 13] show trends consistent with the 2-D analysis results. There are, however, significant and subtle differences. General trends are similar between 2-D and 3-D computational results. However, the interactions between individual defects appear remarkably different between 2-D and 3-D models, even at the same porosity level as seen in Figure 7 for structural response. The differences in defect interactions can be seen directly when we duplicated the porosity pattern found at a slice point in a 3-D model and in a 2-D model.
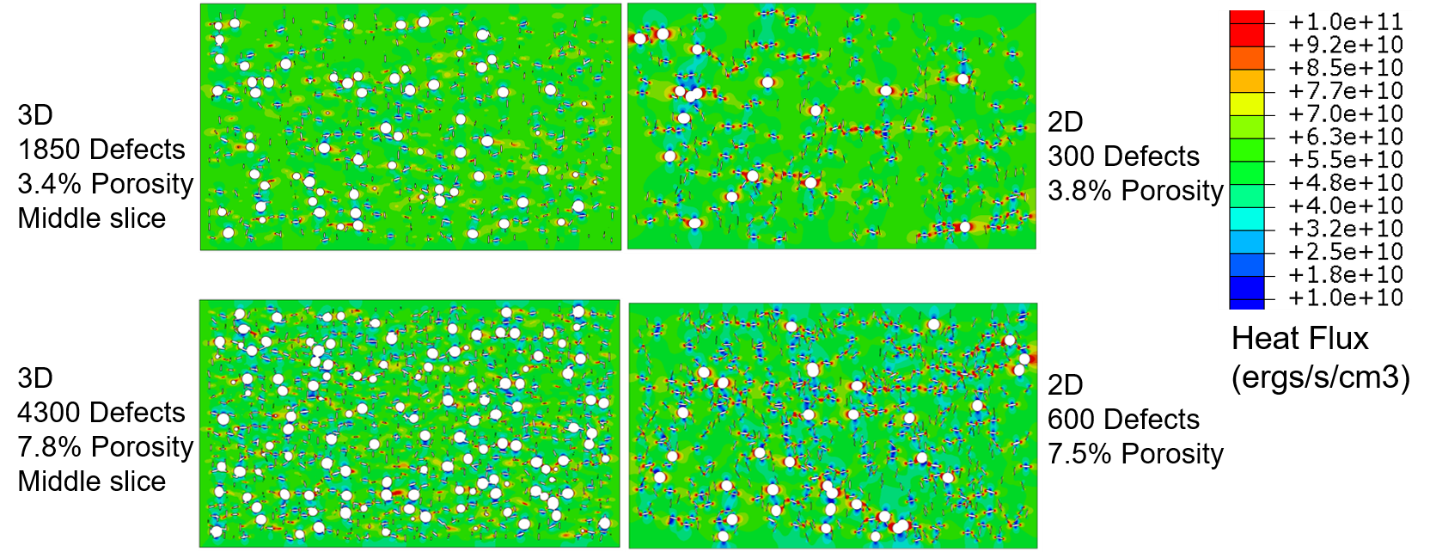
Figure 8 shows the von Mises stress pattern at three slice locations in a 3-D model: (a) 3-D model at Slice 1, (b) 3-D model at Slice 2, (c) 3-D model at Slice 3, (d) 2-D duplication of porosity pattern found at 3-D model at Slice 1, (e) 2-D duplication of porosity pattern found at 3-D model Slice 2, and (f) 2-D duplication of porosity pattern found at 3-D model at Slice 3. In general, the 2-D models’ representation of the porosity pattern has higher stress values concentrated around the defects. Also, the differences in maximum stress values based on localized porosity levels can be clearly seen in both 2-D and 3-D calculated results. Similar results are seen for thermal properties.
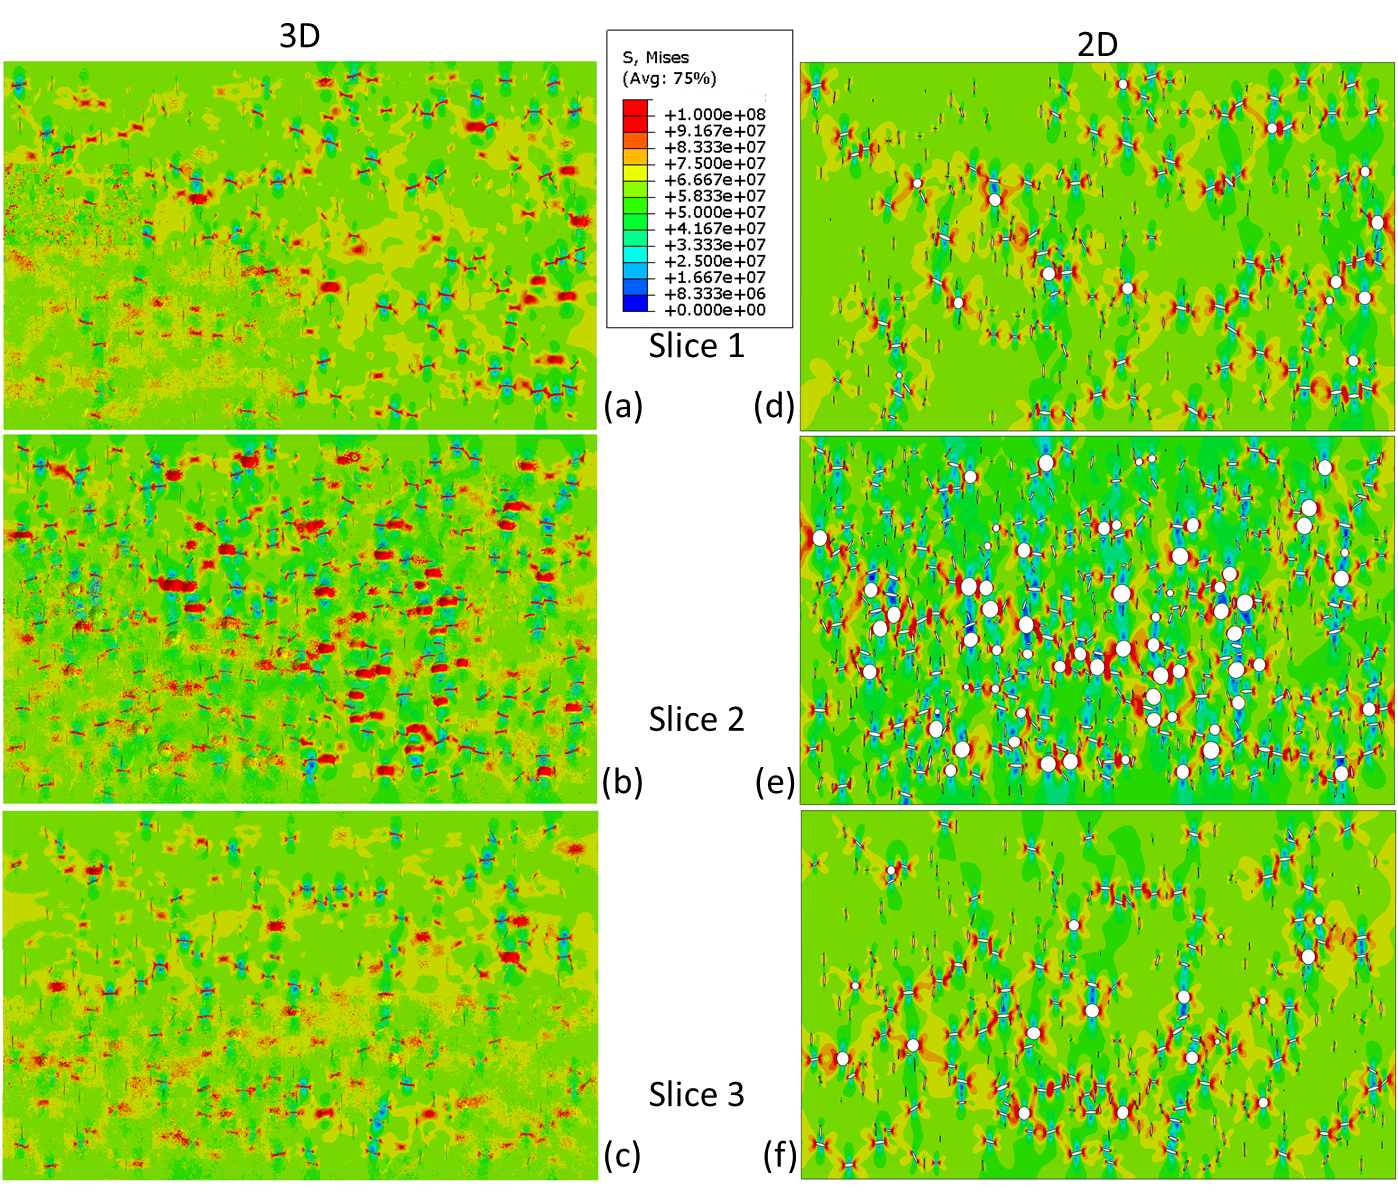
Figure 8: Contour Plots of von Mises Stress (GPa) for Vertical Displacement of Randomly-Distributed Defects (Source: NRL).
While 2-D representations of microstructures, including porosity characterization, have a place in identifying performance trends, the need to understand the variations through the thickness (i.e., the 3-D effect) cannot be understated. As we move forward in designing TBCs, it is important to consider how porosity varies in the third dimension.
CONCLUSIONS
In this article, we have given an overview of NRL’s computational modeling effort to understand thermal and structural characteristics of ceramic TBCs. Initial computational model validation required fabricating nanostructured ceramics with specific porosity levels. This is itself a challenge. NRL has successfully fabricated nanostructured YSZ ceramic with four different levels of porosity ranging from <0.01% to 9%. There is still additional validation work to complete, but this initial effort provides enough to discuss general trends.
In general, computational results indicate that geometric characteristics of defects have had a significant impact on performance. This was consistent, even when multiple defect types were present. For 3-D results, the effective properties taken across a plane could vary significantly based on the localized porosity of the slice. This can result in large variations in calculated, or measured, properties if the characteristics of the volume of material are not correctly identified.
There are three areas in the current computational work which we want to address in the future:
- Model improvements. Along with additional experimental validation, these will provide a robust design tool for ceramic TBCs. To date, we have used a stylized definition of porosity. We want to incorporate real 3-D geometry into our models using microstructure reconstruction techniques and 3-D serial sectioning of representative ceramic coatings to build a database of representative microstructural features, including defect geometries.
- The use of linear material characterization. We plan on incorporating nonlinear thermal and structural properties.
- Additional measures of thermal and structural performance. Currently-used effective properties represent averaged response and obscure localized performance.
The metrics identified will have to amend to computational and experimental measurements. These changes will provide improved computational models, which we can exercise to explore the connection between performance and microstructure, ultimately assisting in developing the next generation of ceramic TBC.
ACKNOWLEDGMENTS
Funding for this project was provided by the Office of Naval Research through the NRL’s Basic Research Program.
The FE analysis was supported by the DoD HPC Modernization Program using the U.S. Air Force Research Laboratory’s Major Shared Resource Center under project 416, subproject 231.
REFERENCES
- Gorzkowski, E. P., S. A. Wimmer, and J. P. Drazin. “Two-Stage Sintering of Nano-Sized Yttria Stabilized Zirconia.” Pacific Rim Conference on Ceramic and Glass Technologies, Waikoloa, HI, May 2017.
- Drazin, J. W., D. A. Kazerooni, E. P. Gorzkowski, C. R. Feng, S. B. Qadri, R. Goswami, B. N. Feigelson, and J. A. Wollmershauser. “Reducing the Size of Nanocrystals Below the Thermodynamic Size Limit.” Crystal Growth Des., vol. 17, pp. 1753–1758, 2017.
- Nakamura, T., G. Qian, and C. Berndt. “Effects of Pores on Mechanical Properties of Plasma-Sprayed Ceramic Coatings.” Am. Ceram. Soc., vol. 83, pp. 578–584, 2000.
- Wang, Z., A. Kulkarni, S. Deshpande, T. Nakamura, and H. Herman. “Effects of Pores and Interfaces on Effective Properties of Plasma Sprayed Zirconia Coatings.” Acta Materialia, vol. 51, pp. 5319–5334, 2003.
- Kulkarni, A., Z. Wang, T. Nakamura, S. Sampath, A. Goland, H. Herman, J. Allen, J. Ilavsky, G. Long, J. Frahm, and R. W. Steinbrech. “Comprehensive Microstructural Characterization and Predictive Property Modeling of Plasma-Sprayed Zirconia Coatings.” Acta Materialia, vol. 51, pp. 2497–2475, 2003.
- Amsellam, O., K. Madi, F. Borit, D. Jeulin, V. Guipont, M. Jeandin, E. Boller, and F. Pauchet. “Two-Dimensional (2-D) and Three-Dimensional (3-D) Analyses of Plasma-Sprayed Alumina Microstructures for Finite-Element Simulation of Young’s Modulus.” Mater. Sci., vol. 43, pp. 4091–4098, 2008.
- Amsellem, O., F. Borit, D. Jeulin, V. Guipont, M. Jeandin, E. Boller, and F. Pauchet. “Three-Dimensional Simulation of Porosity in Plasma-Sprayed Alumina Using Microtomography and Electrochemical Impedance Spectrometry for Finite-Element Modeling of Properties.” Thermal Spray Tech., vol. 21, pp. 193–201, 2012.
- Cronin, J. S., K. Muangnapoh, Z. Patterson, K. J. Yakal-Kremski, V. P. Dravid, and S. A. Barnett. “Effect of Firing Temperature on LSM-YSZ Composite Cathodes: A Combined Three-Dimensional Microstructure and Impedance Spectroscopy Study.” Electrochemical Soc., vol. 159, pp. B385–B393, 2012.
- Wei, S., W. Fu-chi, F. Qun-Bo, and M. Zhuang. “Effects of Defects on the Effective Thermal Conductivity of Thermal Barrier Coatings.” Applied Mathematical Modelling, vol. 36, pp. 1995–2002, 2012.
- 3DS Dassault Systemes. ABAQUS, Providence, RI, http://www.3ds.com/productsservices/simulia/overview/, 2016.
- Wimmer, S. A., V. G. DeGiorgi, and E. P. Gorzkowski. “Influences of Microstructural Defect Size and Distribution for Performance Optimization of Thermal Barrier Coatings.” Proceedings of ASME 2016 IMECE, Paper IMECE2016-66992, 2016.
- Wimmer, S. A., V. G. DeGiorgi, E. P. Gorzkowski, and J. P. Drazin. “Computational Three-Dimensional Microstructure Defect Distributions in Thermal Barrier Coatings.” Proceedings of ASME 2017 IMECE, Paper IMECE2018-70405, 2017.
- Wimmer, S. A., V. G. DeGiorgi, E. P. Gorzkowski, and H. Ryou. “Three Dimensional Modeling of Reduced Material Properties in Ceramics With Added Porosity.” Proceedings of ASME 2019 IMECE, Paper IMECE2019-10608, 2019.
BIOGRAPHIES
VIRGINIA G. DEGIORGI is the head of the Multifunctional Materials Branch in the Materials Science and Technology Division at NRL. Prior to joining NRL, she worked at Westinghouse Electric Corp., where she became the first woman and youngest employee at the time to be awarded the prestigious corporate B. G. Lamme Scholarship. Her research interests include applying computational modeling techniques to diverse fields of study, such as electrochemical corrosion and ceramic thermal barrier coatings. She is a Fellow of ASME and an American Business Women’s Association Top Ten. Dr. DeGiorgi holds a B.S. and M.E. in civil engineering from the University of Louisville and a Ph.D. in engineering mechanics from Southern Methodist University.
EDWARD P. GORZKOWSKI is a materials research engineer and head of the Ceramics and Rapid Prototyping Section at NRL. His research interests include piezoelectric materials for sensor and actuator applications; processing dielectric and ferroelectric materials; unique processing methods to create bulk nanostructured ceramics; and 3-D microstructure characterization and modelling for improved ceramics, such as thermal barrier coatings and capacitor materials. He received the 2015 Du-Co Young Professionals Award and a 2018 Best Paper Award for the Journal of American Ceramics Society. Dr. Gorzkowski holds a B.S. and Ph.D. in materials science and engineering from Lehigh University.
HEONJUNE RYOU is a staff scientist at the Multifunctional Materials Branch at NRL. His multidisciplinary research focuses include interfaces from biofouling organisms, additively manufactured metals, and nanocrystalline ceramics. Dr. Ryou holds a Ph.D. in mechanical engineering from the University of Maryland, Baltimore County.
STEPHANIE A. WIMMER is a mechanical engineer at the Multifunctional Materials Branch at NRL. She has more than 20 years of experience in computational modeling and simulation of structures involving multiphysics, fracture, corrosion, porosity, and nonlinear materials. Dr. Wimmer holds a B.S. in ocean engineering from Texas A&M University and a Ph.D. from the Naval Architecture and Marine Engineering Department at the University of Michigan.