


Background and Motivation
Submarine design is a multifaceted process requiring extensive effort spanning across various disciplines and organizations. Part of this effort is deciding which missions a submarine is expected to conduct and assessing its efficacy, or mission effectiveness, in those missions via constructive simulation. This approach—characterizing a notional platform and simulating its performance in stressing tactical situations—has been and continues to be the foundation of most analytic products produced by the warfare analysts of the Undersea Warfare Mission Engineering and Analysis Department of the Naval Undersea Warfare Center Division Newport. It allows analysts to quantify the effect of different aspects of the platform, such as its acoustic profile or maneuverability, in terms of mission effectiveness. They can then answer questions such as, What sort of payloads should the submarine have to meet its mission goals, or what sensing capability is required to meet a threshold of mission effectiveness?
To ensure that a submarine concept can meet mission requirements, the conceptual submarine must first be adequately characterized, typically by defining features such as the type of sensor systems it possesses, how it maneuvers, its acoustic profile, and its weapon composition. It can then be assessed across relevant, stressing scenarios, many of which may have competing objectives. For instance, a conceptual submarine may favor the use of torpedoes in one mission while preferring the use of missiles for another. Stowage aboard the platform is limited due to spacing, so the decision must be made as to how to balance both the number and type of weapon to meet competing mission requirements. By simulating submarine performance across various missions, analysts can quantify the trade-offs associated with each design decision.
While much is to be gained from this approach, stakeholders may find themselves limited when attempting to gauge the mission effectiveness of a platform at input levels that were not originally run as part of the constructive simulation. For example, if three levels of submarine speeds—5 knots, 15 knots, and 25 knots—were simulated as part of a study and the customer was interested in what the associated mission effectiveness at 10 knots would be, the customer is relegated to mental means of interpolation to estimate the quantity. While this is achievable in lower dimensional space, it quickly grows difficult in the presence of additional attributes (such as submarine acoustic profile, maneuverability, and sensing capability), as does the visualization of these estimates. Furthermore, that customer may not have the operational context and assumptions (threat capability or environmental conditions) readily available to make informed design decisions.
It is through the Undersea Warfare Mission Engineering and Analysis Department’s Mission Effectiveness (ME) Dashboard that analysts and customers can rectify these shortcomings and facilitate the concept assessment process. This article will review the capabilities of the Dashboard, the mapping models that translate architectural design components into Dashboard inputs, and its application in evaluating a notional submarine concept with the goal of attributing mission performance to the submarine concept’s subsystems.
Introduction
The ME Dashboard is a browser-based tool designed to allow users to understand and study background and assumptions, quantify relationships between performance attributes, generate new data, make predictions, conduct constrained optimization, and visualize outputs as part of the process of making informed submarine design decisions. The Dashboard’s landing page is shown in Figure 1, where all attributes and their values with the surrogate models are arbitrarily chosen and meant to illustrate the Dashboard’s capabilities.
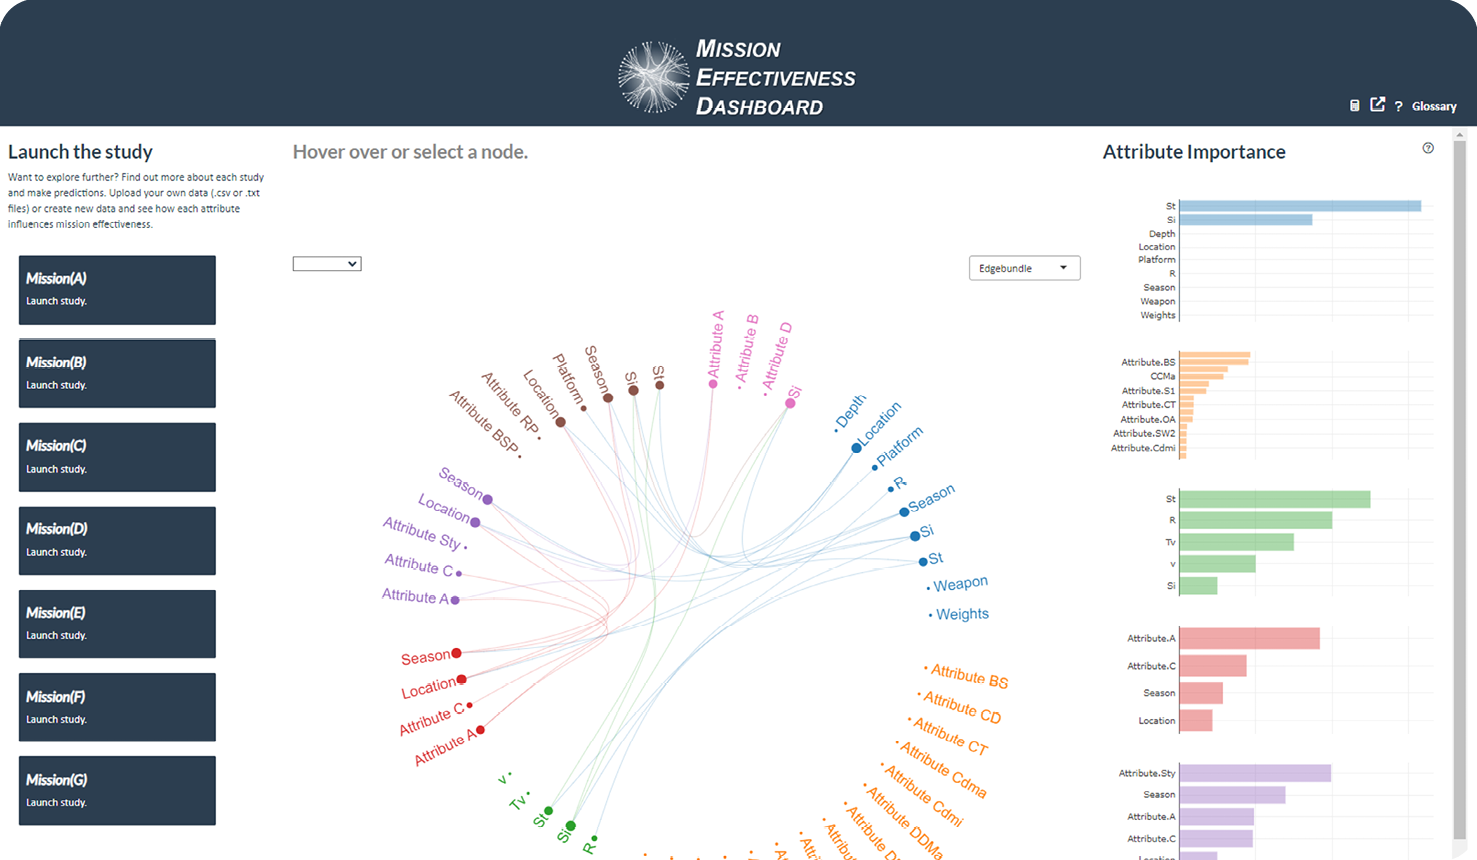
Figure 1. The ME Dashboard Landing Page (Source: J. Proule).
By quantifying the military utility of submarine subsystems, the Dashboard can be used as a scoping mechanism to identify those technologies that require further study and analysis. The scoping process begins with naval architects who develop conceptual submarine designs, each consisting of thousands of descriptive parameters such as displacement, weight, length, diameter, and sensor configuration. Conceptual submarines may have unique features that do not easily align with existing submarine classes. The architects want to know the designs are worth additional study by assessing how well they would perform in several mission contexts and learn more about the impact of different design components on mission effectiveness. Furthermore, they wish to determine if improvements can be made to the design and, if so, what sensitivities exist, and what are the minimal amount of changes that can be made to yield the largest improvement in mission effectiveness? Answering these questions comes with several challenges, as there is a translation required that maps the design components of the submarine to mission inputs. This scenario is typical of the questions warfare analysts face and can answer via mapping models in conjunction with the Dashboard. After briefly reviewing the different aspects of the Dashboard, we will return to this scenario to review mapping models and see how it can be employed to address the idea of attributing mission performance to submarine subsystems.
The ME Dashboard
Prediction
The foundational competency of the ME Dashboard is its predictive capabilities. Derived from the ideas of response surface methods associated with classical experimental design techniques, the Dashboard houses a collection of statistical and machine-learning models that act as fast-running surrogates to slower running, higher fidelity models. These higher fidelity models are used to simulate submarine performance for each mission it is expected to conduct. The inputs and outputs from these simulations are captured as the covariates and response variable used in the training/fitting of the surrogate models in a supervised fashion.
These surrogates provide estimates of what the higher fidelity models would produce if they were used to simulate over inputs of interest. The Dashboard houses the following types of surrogate models:
- Elastic net regularized regression
- Generalized additive models
- Binary logistic regression
- Beta regression
- Binary Gaussian processes
- Treed Gaussian processes
- Gradient-boosted trees
- Multiadaptive regression splines
- Feed-forward neural networks
Which surrogate model is applied to which mission depends on the type of input data that is under consideration. Lower dimensional, all-numeric data tend to be represented well by Gaussian processes; this class of surrogate models can capture the predictive variance of numeric data that does not exhibit any step function-like behavior. Conversely, data with many categorical features may be better fit with tree-based models. These surrogate models may be stacked or combined/extended via boosting, bagging (bootstrap aggregation), or other ensemble methods and may require additional feature engineering on the original data produced from the simulation run with the higher fidelity model. The only constraints on the surrogates are that they are relatively quick to load and operate (does not exceed five seconds) and they generate predictions with low (<3%) generalizable error (a measure of how accurately an algorithm can predict outcome values for previously unseen data). This generalizable error is assessed via different kinds of nested cross-validation or other forms of out-of-sample assessments such as train-test-validation sets and bootstrapping. To help reduce this generalizable error and foster the creation of highly predictive surrogate models, the higher fidelity models typically simulate over specialized experimental designs that allow nonlinear effects to be realized. These experimental designs are often space-filling designs that offer exceptionally strong coverage over the tradespace of interest or they may be a hybrid between space-filling and classical experimental designs (fractional factorial or D-optimal designs).
Through its user interface, the Dashboard offers users the ability to upload data or manually enter it within the browser and then generate predictions with the click of a few buttons (Figure 2). There are no command-line interactions or coding requirements, and users can download predictions for further analysis.
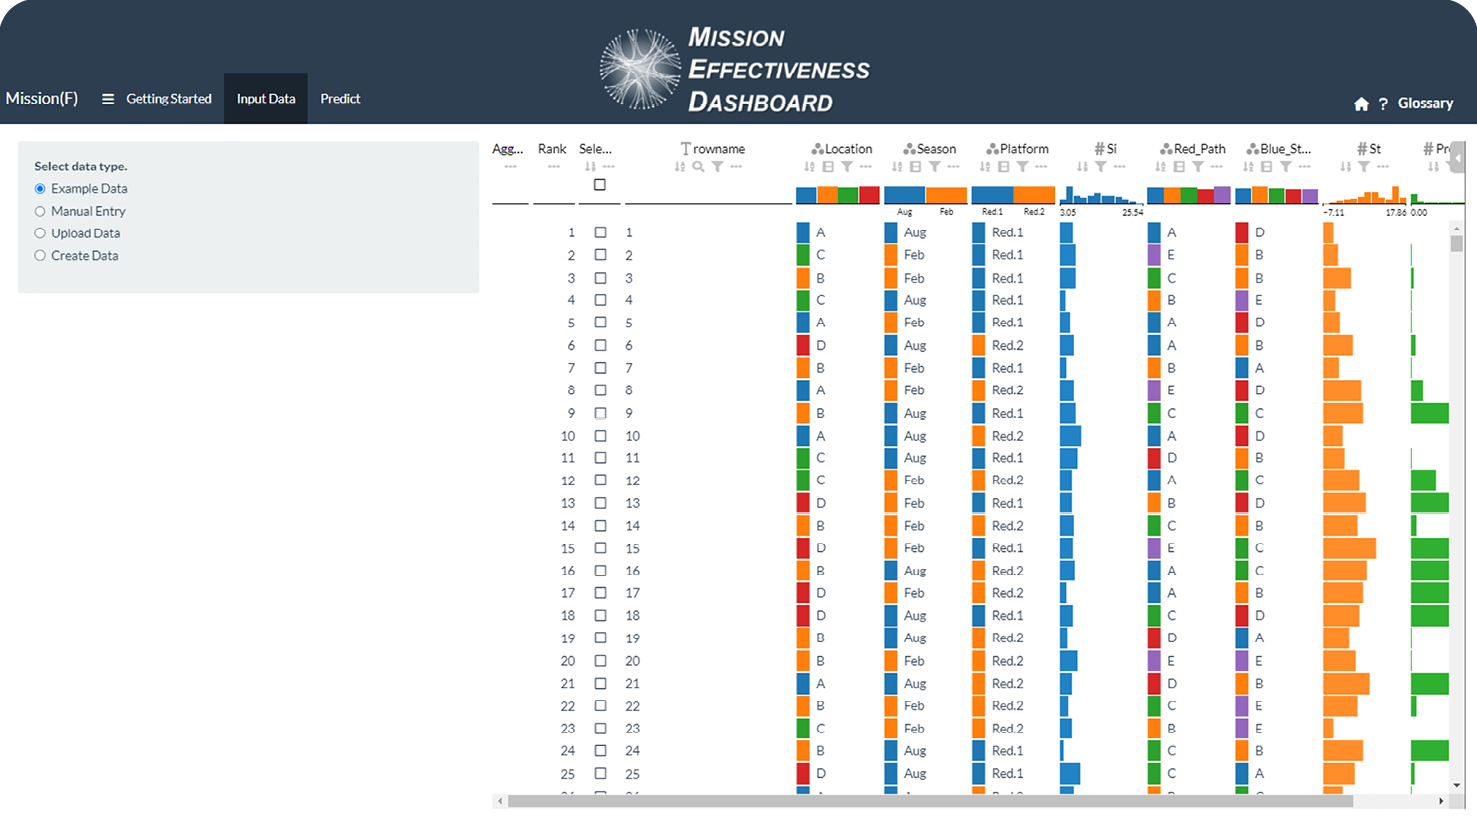
Figure 2. Data Upload Window Screenshot for a Single Mission in the ME Dashboard (Source: J. Proule).
Inference and Visualization
In addition to downloading the predictions generated from the surrogate models within the ME Dashboard, users have the option to investigate the predictions via various visualizations and inference methods. They can employ any of the following to graphically depict their predictions or the example datasets that come with each housed mission:
- Heatmaps
- Treemaps
- Scatterplots and scatterplot matrices
- Sunburst plots
- Parallel coordinate plots
- Correlation matrices/plots
- Histograms
- Density plots
- Boxplots
While these techniques are useful means to quickly identify and plot trends and gradients within the data, users are also supplied with options to quantify these trends via more rigorous means like the following:
- Individual conditional expectation plots
- Partial dependency plots
- Beeswarm and waterfall plots to visualize SHapley Additive exPlanations (SHAP)
- Breakdown plots
- Variable importance plots
- Sobol indices plots
- Friedman’s H-statistic plots
- Plots to visualize t-distributed stochastic neighbor embedding and principal component analysis
- Plots to visualize anomalies quantified via autoencoders
All these visualization and inference approaches are model agnostic; they can be applied to any of the surrogate models listed in the subsection titled “Prediction.” Many of the more computationally intensive techniques have already been applied to the example datasets for each mission and come preloaded within the Dashboard to provide a starting intuition about the data. For instance, by examining the precomputed variable importance plots, users may learn that the speed of the submarine was the most influential factor within the context of a specific simulated mission. They may use the partial dependency plots to identify the general trends speed has across different missions and what minimal average speed is required to meet a threshold of mission success. A submarine design can be tailored to meet that speed while then being modified with other considered influential attributes. This modification can happen using counterfactual analysis, which is a process by which users can identify the minimal changes in inputs that yield a desired output via multiobjective optimization. It can be done in a constrained fashion wherein some of the inputs are not permitted to change. Within the context of the Dashboard, this technique allows analysts to determine if major improvements in mission success can be achieved within the local tradespace and, if so, what changes need to be made to the inputs’ variables. It can help guide analysts on how to reach a desired threshold measure of effectiveness given a specified starting point.
Figure 3 shows an outlier investigation window of the Dashboard, where outliers are highlighted in the histogram of autoencoder reconstruction errors for a mission. The selected points are described in a summary table and automatically highlighted in a scatter plot and SHAP plot.

Figure 3. Outlier Investigation Window Screenshot of the ME Dashboard (Source: J. Proule).
Operational Context
The ability to generate and visualize predictions can be an incredibly powerful capability, but it can also prove damaging and lead to faulty conclusions if lacking the requisite background knowledge. Without a strong understanding of the underlying assumptions of the simulation inputs that generated the data in the first place or how a measure of effectiveness is calculated, the user has the potential to misunderstand or misrepresent the outputs to decision-makers.
To help remedy this issue, the ME Dashboard comes with briefs for each of the corresponding missions (Figure 4). Partial dependency plots are drawn for a selected attribute that is categorical in one mission and continuous in another mission. Study briefs detailing the development and results of a constructive simulation for each mission are hyperlinked in a table that also shows correlations of attributes shared between missions. These briefs are generated by analysts as part of their customer deliverables and typically provided as a static analysis in PDF format upon the study’s completion. They detail how the higher fidelity model was constructed, what intelligence sources and environmental inputs were used, what tactics were employed, what third-party dependencies and collaborations existed, and what insights were gained from running the simulation. Complementing the briefs are graphics associated with each mission mapped on a globe to provide a less intensive but faster review of the operational context of the mission. By incorporating these elements into the Dashboard, users can understand the underlying implications of the predictions they are generating.
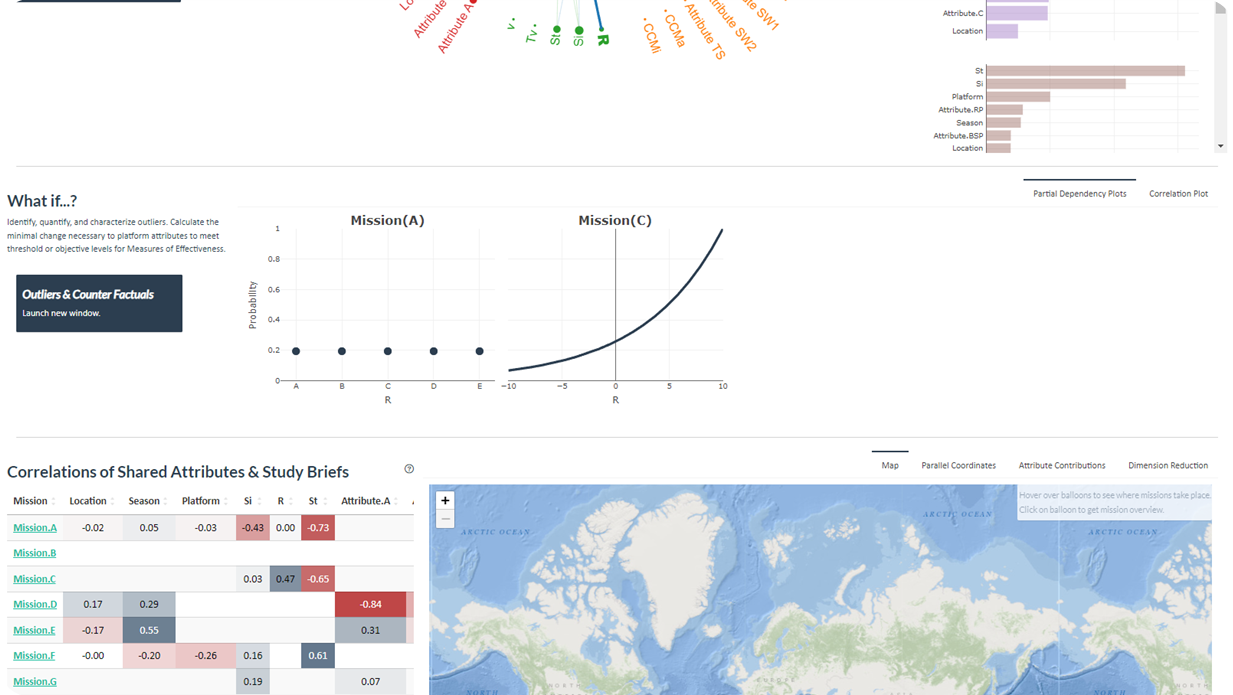
Figure 4. Screenshot of the ME Dashboard Landing Page (Source: J. Proule).
Application and Mapping Models
Returning to the scenario in the Introduction, suppose there are three missions that can be used to assess the efficacy of a submarine design—Mission A, Mission B, and Mission C. Each of these requires a unique set of tactics stressing different aspects of the submarine’s build (information that is detailed in the briefs housed in the ME Dashboard). For each mission, a high-fidelity model is used to simulate combinations of relevant inputs and generate a metric of interest (i.e., some form of probability of success). We see this represented in Figure 5, where the authoritative model (high-fidelity model) ingests measures of performance (relevant inputs to the high-fidelity model) as well as contextual information to produce a measure of effectiveness. Once the simulations in the high-fidelity model are complete, the outputs are used to generate three briefs and three separate surrogate models (one for each mission) to comprise the surrogate model set housed within the Dashboard. The predictions resulting from the surrogate models are used to explore the tradespace by generating various explanatory visualizations that highlight the sensitivities present in each mission and quantify the marginal impact of each attribute. The platforms with many torpedoes and higher speeds tended to do well in Mission A, whereas platforms with lower radiated noise and lower speeds did better in Mission B. While these insights help guide the architects in their conceptual submarine design, more information is required to help establish a concrete link between their designs and the impact on mission effectiveness.
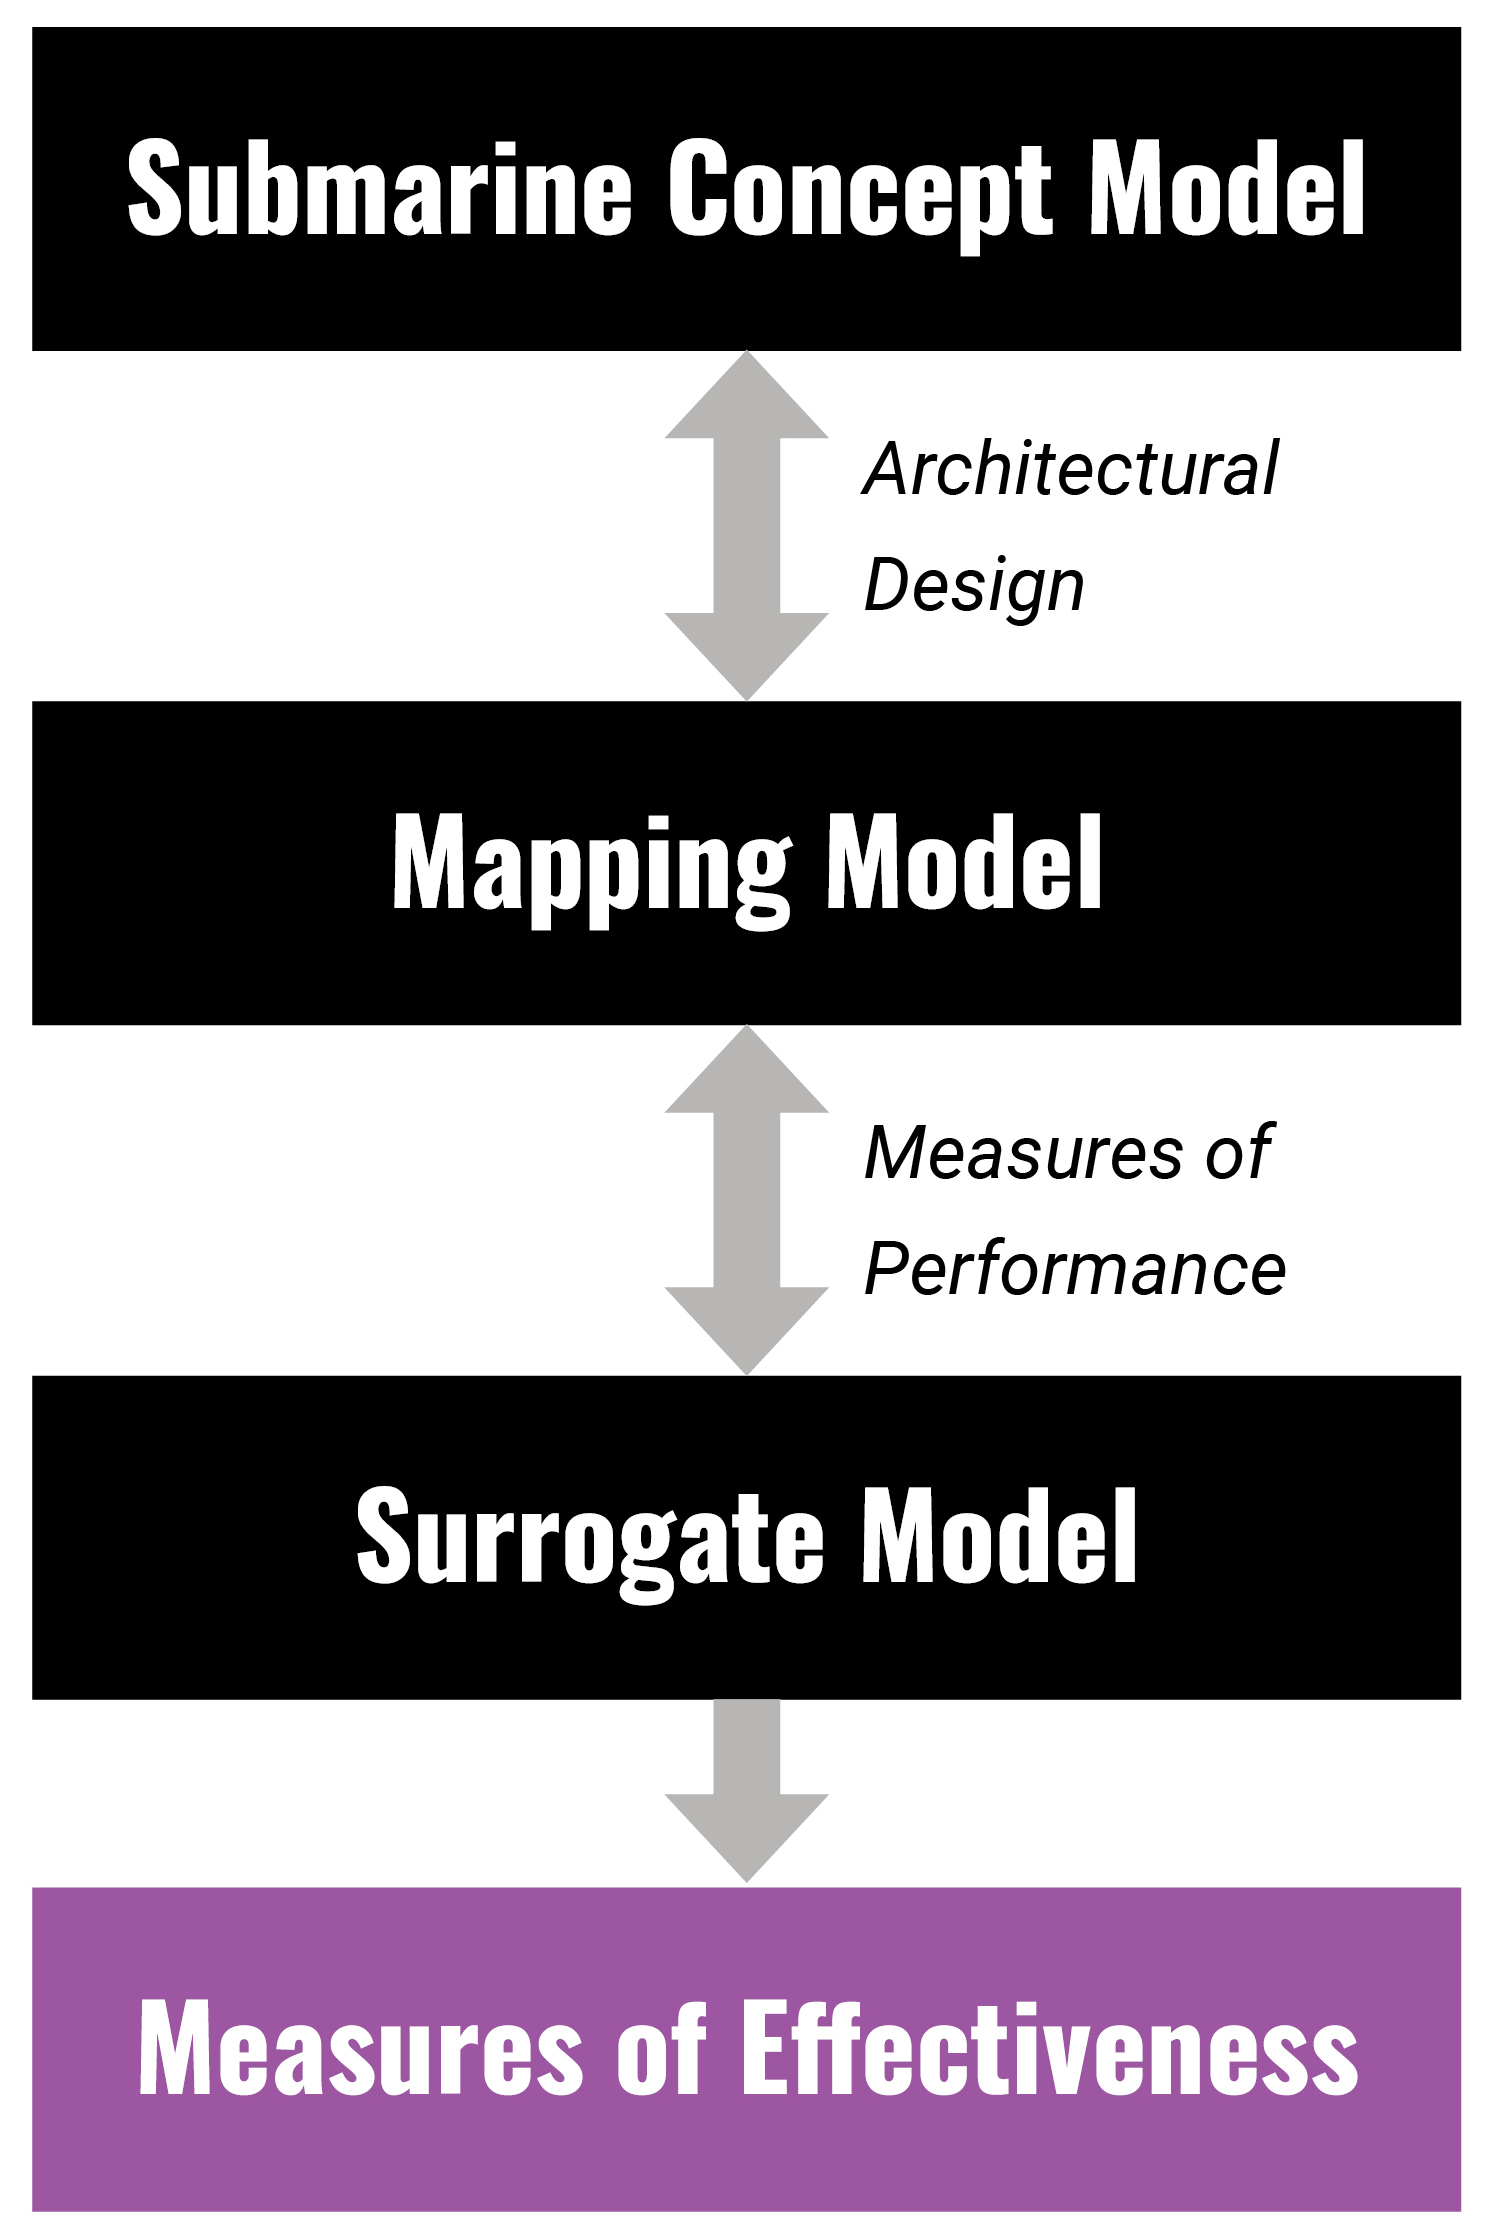
Figure 5. Submarine Concept Evaluation Flowchart (Source: J. Proule).
To establish this link, one first must recognize that many of the simulation inputs are measures of performance rather than architectural design decisions and do not map directly back to the architect’s plans. For instance, the speed of a submarine is not an architectural component but rather a calculated byproduct of its design. Submarine propulsion, along with diameter and other drag-related features, combine to produce a speed. Similarly, the number of weapon tubes in conjunction with storage and launching systems dictates the submarine’s weapon salvo rate. These features require mapping models to translate the effect of design decisions on measures of performance, which can then be ingested by the surrogate models to generate measures of effectiveness (or mission success).
Figures 5 and 6 depict the process of how a third party is required to convert architectural components into surrogate model inputs. In the previous example, a payload’s working group may act as the mapping model needed to convert the number of torpedo tubes and launching systems (which fall within the architectural design components of Figure 6) into a salvo rate that can be used by the simulation. This salvo rate is a measure of performance that can be used to generate a prediction of mission effectiveness with the surrogate model.
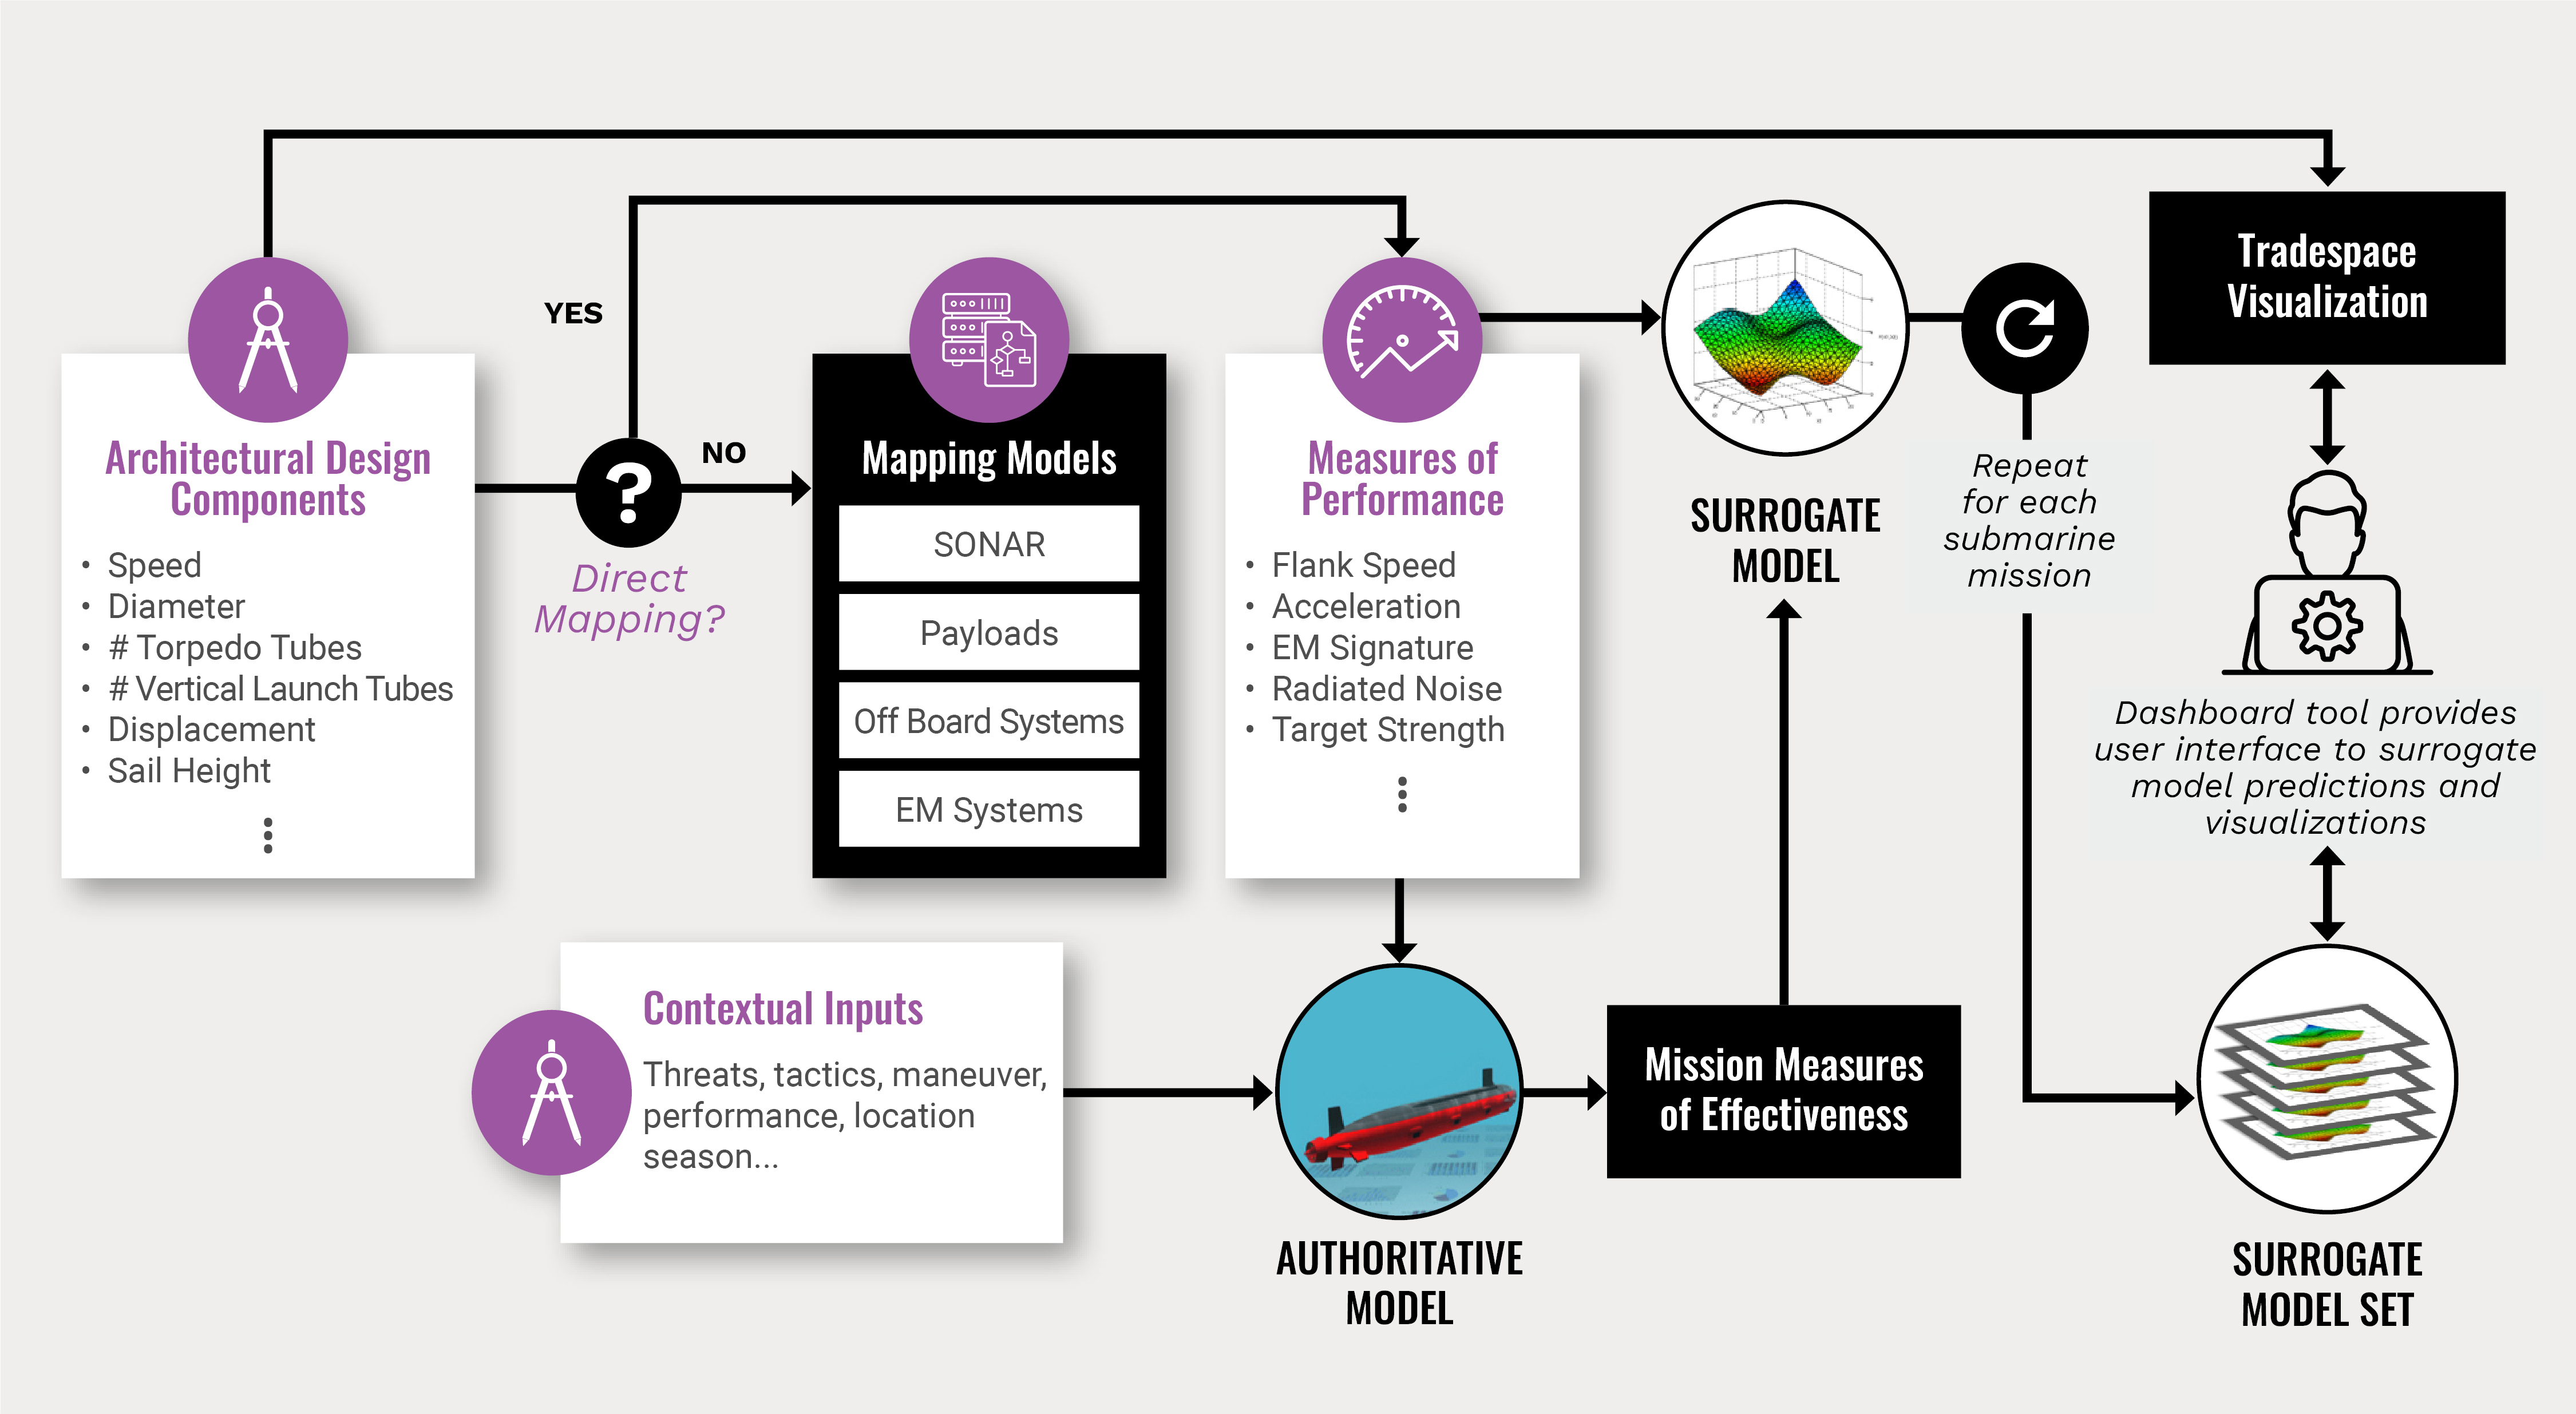
Figure 6. Information Flow From Architect to Analyst (Source: J. Proule).
These mapping models are often exceedingly complex, physics-based models that have been developed for years and maintained and improved by highly trained domain experts. The subject matter expertise of these domain experts is leveraged to convert architectural design components into inputs that can then generate the measures of performance used by the surrogate models.
To further illustrate the importance of a mapping model, we consider a submarine’s methods of communications with external entities. While getting more information can be beneficial in directing a search for a threat platform, it also puts the submarine at risk of being detected by surface/air assets and can reduce its search rate due to slowed speeds and changing acoustic profiles in the water column. There is both a cost and benefit to increasing and decreasing the frequency of communications. In the context of a high-fidelity constructive model that simulates the submarine in a mission requiring communications between platforms, the frequency is simply represented as a scalar value dictating how often the submarine receives information; there is no direct link to its architectural components. A mapping model is required to translate this scalar value to communication subsystems, such as different types of masts. Different masts can have major design implications and force the architect to include different technologies into the conceptual submarine. It is through these mapping models that a submarine subsystem defined by architectural means can be linked to measures of performance (a communications cycle) that can then be ingested by the surrogate models to produce a measure of effectiveness.
After generating the predicted measures of performance through this translation process, analysts can assess how well a design can complete the three different missions by uploading its characterization into the Dashboard and generating predicted measures of effectiveness. How well a conceptual submarine does in each mission is largely contextually dependent—all nondesign attributes like location, season, or threat speed vary to yield a spectrum of mission effectiveness for each mission. Analysts can visualize how a single design fares against competing designs that have previously gone through this process if it can be considered an outlier and improvements can be made. Furthermore, they can use the optimization tools present in the Dashboard to find counterfactuals. For example, if a specific design was expected to have a 63% probability of success in Mission B and the threshold architects were attempting to meet was 75%, they can identify the minimal amount of change necessary to characterize the design that will yield a 75% success rate.
Given this information, the analyst must then coordinate with the architects and subsystem experts to translate these measures of performance back to architectural features of the conceptual submarine design (see Figure 1). It is in these translations (the mapping models) where much of the difficulty lies and conflicting assumptions across organizations operating these tools are possible. Much of the success of the mission-effectiveness attribution process depends on this translation process and is still in the development process.
Conclusions
By relying on surrogate models to quickly evaluate thousands of possible conceptual submarine designs while bypassing the slow revisitation of the authoritative model, analysts can eliminate low-performing designs and, with the aid of mapping models, attribute varying levels of mission success to different subsystems. A vital step in this process, the mapping models necessitate a communicative, iterative pipeline between architect and domain experts to produce the measures of performances required by the ME Dashboard, where analysts can perform the following:
- Conduct sensitivity analysis to identify high-gradient areas in the tradespace or areas that meet minimum thresholds of performance across different missions.
- Identify what attributes are common to succeed in multiple missions.
- Identify the highest performing scenarios to see if/when specialization matters.
All three aspects help the architect and analyst identify the locally optimal submarine design that yields the highest military utility given cost and building constraints. Of course, this approach is not limited to submarine design. Such benefits are transferable across industry, as these techniques are germane to applications that rely on high-fidelity, slow-running models or physical, real-world tests that are expensive and difficult to coordinate. Using these techniques, organizations can make the intelligent choice on how to focus their efforts for further analysis and investment.
Biography
Jonathan Proule is a senior warfare analyst at the Naval Undersea Warfare (NUWC) Division Newport. After spending three years in the Sensors and Sonar Department at NUWC, he moved to the Undersea Warfare Mission Engineering and Analysis Department as a warfare analyst. Mr. Proule holds a B.S. in industrial engineering and systems engineering and an M.Eng. in technology management from Rensselaer Polytechnic Institute and an M.S. in operations research from the Georgia Institute of Technology.