


ABSTRACT
Using selected principles in design of experiments, the researcher conducted a simulation-based missile hit-point study that explored the conventional practicality of a typical survivability investigation. The relationship of aircraft susceptibility to missile attack is a well understood function of one or more missile launch parameters. Specifically, the researcher explored the statistical relationship between the missile’s launch azimuth and the resultant variations in the magnitude of point-of-closest-approach (PCA) miss distances to the aircraft.
INTRODUCTION
The development of an effective evaluation method that addresses the survivability issues of concern for a large aircraft system under study within available fiscal resources and practical bounds was required. The researcher believed the most effective domain to achieve this objective was through the use of modeling and simulation (M&S) and applied design of experiments (DOE) principles/methods.
The experiment had two objectives. First, establish a susceptibility baseline for an unprotected commercial-derivative large aircraft against a typical ground-launched missile threat using highly specialized hardware-in-the-loop (HITL) simulation and aircraft modeling techniques. Second, use simulation-generated hit-point concentrations (susceptibility) to narrow the scope of follow-on vulnerability assessments to areas on the aircraft that have the highest vulnerability potential.
The overarching purpose of the study was to relate specific launch parameter groupings and resultant concentrations of hit-points with specific areas of the aircraft. If a relationship existed, the strength of that relationship was used to suggest a basis for prioritizing where and to what extent follow-on susceptibility and vulnerability investigations were conducted. However, the researcher’s ulterior purpose was to use this study as an opportunity to apply DOE methods in an attempt to document potential improvements to an older, less efficient process.
Experiments of this nature can involve an infinite number of parametric permutations and replicates. The researcher chose to limit the missile launch parameters to doctrinally sound distributions of launch range, elevation, and azimuth about the target aircraft. Also, the aircraft flight regimes were limited to nominal airspeeds and altitudes indicative of take-offs and landings. Although excursions combining launch and flight parameters that resulted in extraordinary engagements were examined in this study for completeness, they were not considered here.
Hypothesis
Research in the area of HITL modeled or simulated aircraft/threat interactions is highly specialized and on the forefront of advancing the science of modern aircraft survivability evaluation. Accordingly, virtually no specific literature on this topic exists, which prevented the ability to formulate a hypothesis based on a literature review. However, the researcher’s direct association with many projects related to this research topic allowed the development of a hypothesis based on years of personal experience and first-hand knowledge of deficiencies in aircraft survivability investigative methodologies.
The researcher believed combinations of independent missile launch and aircraft flight regime variables may have a statistically significant influence on the end-game outcome represented by several dependent variables. Studying the launch azimuth’s influence on the resultant magnitude of the PCA miss-distance posed a particularly interesting and powerful relationship. While this test represents only a single interaction of many possible interactions, it serves two intertwined purposes. That is, it tests that a statistically significant relationship does (or does not) exist, between missile launch parameters and a target aircraft.
As such, the researcher submits that the missile’s launch azimuth results in a statistically significant difference in the magnitude of the PCA miss-distance (hypothesis). Alternatively, the missile’s launch azimuth does not result in a statistically significant difference in the magnitude of the PCA miss-distance (null-hypothesis).
RESEARCH METHODS
Research Design
This descriptive study was conducted at the Guided Missile Evaluation Facility located at Eglin AFB, FL. The end-game outcomes of HITL simulations of doctrinally typical missile engagements against a modeled commercial-derivative class aircraft were evaluated. The outcomes were expressed in terms of missile PCA distances to the missile seeker’s track-point as a function of varied launch parameters (i.e., azimuth, elevation angle, and range to target).
The missile-to-target engagement matrix for this study was vast, and a comprehensive discussion of its results would have been both interesting and revealing, but not consistent with current classification guidelines. Instead, the researcher devised a method of aggregating the experimental input factors/ levels as well as the resultant output responses in a manner that tested the hypothesis without implying the susceptibilities and/or vulnerabilities of a specific aircraft-threat interaction.
Research Model This study was based on experimentally modeled and simulated missile engagements against a commercial-derivative aircraft. Descriptive and inferential statistics were applied to each of six sample groups used to summarize the data. Significance was tested by performing a parametric analysis of the variation (ANOVA) between the resultant PCA miss distances in each group. The magnitude in variation was used to test the hypothesized influence of the combinations of independent missile launch parameters on the dependent PCA miss-distance outcome. All analysis was performed with the aid of the Statistica™ software package.
Sources of Data For each simulated missile engagement, there were two data source categories: pre-determined input data and resultant output data.
The predetermined input data consisted of the beginning state data for the missile engagement scenario. The input data comprised the missile type, missile launch parameters (range, elevation, and azimuth to the target), and the target aircraft state (take-off/landing, altitude, and airspeed).
As the experimental engagement executed, resultant output data were collected. The primary output data consisted of PCA distance to the target or a distribution of hit-points on the target aircraft. These output data supported (or did not support) the relationship between the beginning state launch parameters and specific targeted locations on the target aircraft based on concentrations of hit-points.
Forensic output data from the missile guidance module were collected. These data, which provided a phenomenological basis for a given missile trajectory that led to a miss or hit, included component velocity vectors, angle-of-attack, yaw, pitch, and roll.
RESULTS
Table 1 contains all of the simulated PCA miss-distance data points used to test the researcher’s hypothesis. This data set is a smaller subset of a much larger data set generated by the researcher’s overall work-related study. The table is arranged by take-off (left) and landing (right) factors subdivided into the respective azimuth levels considered for each factor. Two discrete data groups subdivided into three subgroups are shown. Note that the PCA miss-distance data are depicted as unitless values to protect the sensitivity of the subject matter.
| Minimum PCA Miss Distance (All Elevations and Ranges) | ||||||
| Take-Off | Landing | |||||
| Nose | Beam | Tail | Nose | Beam | Tail | |
| 4.16270 | 3.01850 | 0.88181 | 3.11490 | 1.21960 | 0.93218 | |
| 3.69140 | 1.90110 | 0.63007 | 4.00580 | 1.60030 | 1.19680 | |
| 4.50270 | 3.87370 | 1.33360 | 3.05870 | 2.90620 | 1.35210 | |
| 5.98830 | 0.53953 | 1.04670 | 2.12920 | 2.76980 | 0.91673 | |
| 5.46900 | 0.68031 | 1.03410 | 3.83330 | 2.30770 | 1.75070 | |
| 5.47860 | 4.12850 | 1.00590 | 3.51370 | 2.25950 | 1.61610 | |
| 8.03190 | 2.23970 | 0.05841 | 1.07950 | 1.00370 | 0.70954 | |
| 5.94380 | 3.96640 | 0.64044 | 1.23610 | 1.92480 | 1.19240 | |
| 8.15030 | 4.59070 | 1.22090 | 2.43630 | 2.91240 | 1.05040 | |
| 4.84800 | 5.31210 | 1.07150 | 2.53710 | 1.21780 | 0.42839 | |
| 6.60410 | 1.46140 | 0.66422 | 0.81787 | 1.42500 | 0.55169 | |
| 5.60030 | 3.91750 | 0.98527 | 1.15170 | 2.01100 | 0.48412 | |
| 1.20780 | 5.25190 | 1.36800 | 1.76840 | 0.59498 | 1.07190 | |
| 0.47520 | 10.16430 | 1.57580 | 0.78415 | 1.03400 | 0.97170 | |
| 0.71456 | 7.17390 | 1.12260 | 1.47450 | 0.59137 | 1.38740 | |
| 1.31010 | 6.07440 | 1.43850 | 1.29710 | 1.21000 | 1.65450 | |
| 0.13549 | 11.36810 | 0.94782 | 0.72409 | 1.40330 | 1.84240 | |
| 1.38010 | 6.87260 | 1.62100 | 2.16890 | 1.84260 | 2.92330 | |
| 1.31740 | 5.05620 | 0.92419 | 2.70370 | 1.02230 | 1.40400 | |
| 1.48550 | 3.91350 | 1.07670 | 0.53166 | 1.22980 | 0.87233 | |
| 0.35331 | 1.71410 | 1.30880 | 2.10760 | 0.99266 | 0.97832 | |
| 1.66670 | 5.66770 | 0.79713 | 8.86230 | 0.33405 | 0.87594 | |
| 1.41340 | 4.72500 | 2.72630 | 1.69240 | 1.32400 | 0.63682 | |
| 0.67842 | 5.70320 | 1.96070 | 0.79844 | 1.11790 | 0.27324 | |
| 4.91420 | 1.52340 | 0.59818 | 0.75686 | 3.17170 | 0.20338 | |
| 4.36280 | 2.42260 | 0.85379 | 1.01250 | 2.51390 | 0.40944 | |
| 4.06790 | 4.15220 | 1.11780 | 3.02200 | 5.46980 | 0.41617 | |
| 6.52870 | 0.73006 | 0.86805 | 0.49533 | 1.93890 | 0.49160 | |
| 5.15390 | 1.67480 | 1.56040 | 1.29400 | 4.28940 | 0.94346 | |
| 5.97110 | 0.90342 | 1.36860 | 0.96699 | 1.91210 | 0.61320 | |
| 3.33380 | 1.35790 | 0.65991 | 3.10440 | 3.35580 | 1.19150 | |
| 1.34050 | 5.15640 | 0.73376 | 3.40530 | 3.18680 | 1.03920 | |
| 4.58330 | 2.50350 | 0.53137 | 2.46560 | 1.32910 | 0.66239 | |
| 4.58240 | 3.90950 | 1.31030 | 1.83690 | 1.95390 | 0.86711 | |
| 1.54760 | 0.49018 | 1.23250 | 3.11410 | 2.79870 | 1.58460 | |
| 3.78120 | 3.02020 | 1.19850 | 2.68870 | 4.90220 | 1.61410 | |
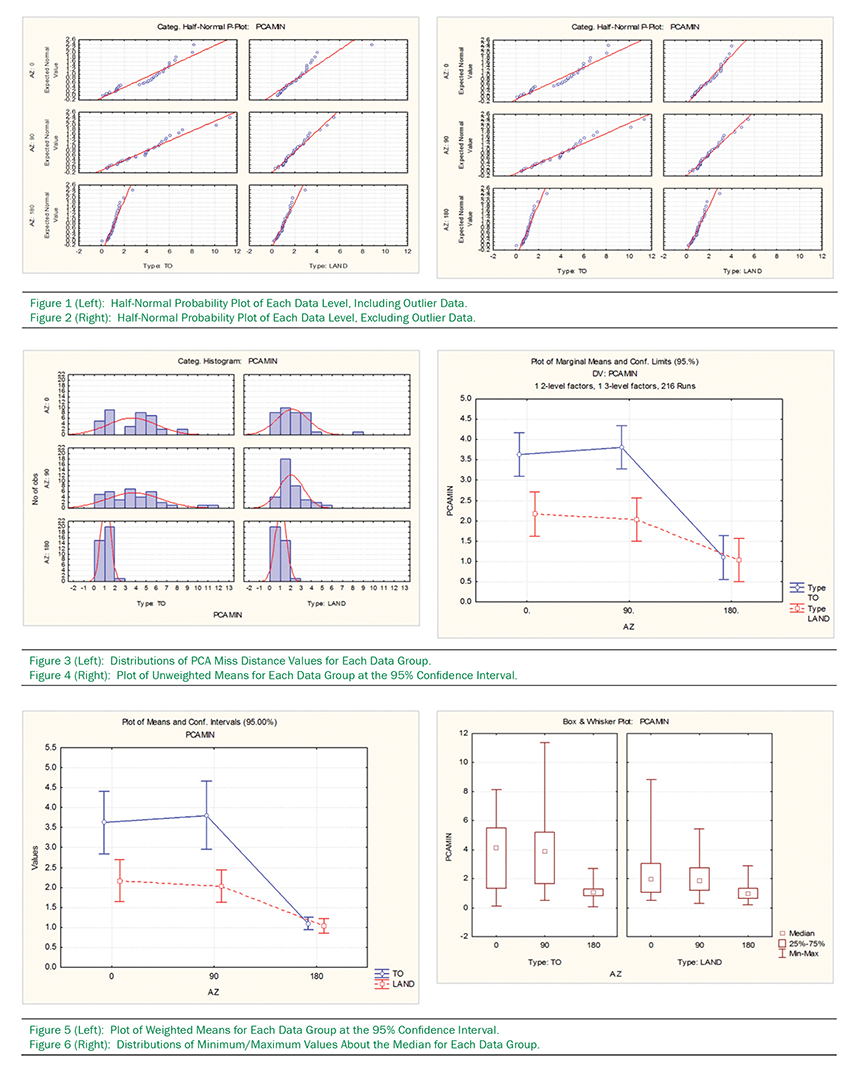
Figures 1 and 2 are half-normal probability plots (p-plot) for each of the six azimuth levels summarized in Table 1.
Figure 3 is a histogram plot of the number of PCA magnitude value observations within each specific data level in Table 1. A fitted, normalized curve through the data is represented by the red line.
Figure 4 is a plot of the unweighted mean PCA miss-distance values for the azimuth levels within each flight regime factor. Each mean value point is characterized by its respective 95% confidence limits (vertical bars).
Figure 5 is a plot of the weighted mean PCA miss-distance values for the azimuth levels within each flight regime factor. As with Figure 9, each mean value point is characterized by its respective 95% confidence limits (vertical bars).
Figure 6 is a box-and-whisker plot of the median PCA miss-distance values for the azimuth levels within each flight regime factor. Each median value point is characterized by maximum and minimum PCA miss distance (vertical bars) for each level as well as the distribution of the middle 50% of each level’s data points.
| Factor | ANOVA; Var.:PCAMIN; R-sqr=.31503; Adj:.29872 1 2-level factors, 1 3-level factors, 216 Runs DV:PCAMIN; MS Residual=2.685887 |
||||
| SS | df | MS | F | p | |
| (1)Type L | 65.8164 | 1 | 65.81640 | 24.50452 | 0.000002 |
| (2)AZ L+Q | 163.6008 | 2 | 81.80042 | 30.45564 | 0.000000 |
| 1*2 | 29.9951 | 2 | 14.99753 | 5.58383 | 0.004338 |
| Error | 564.0364 | 210 | 2.68589 | ||
| Total | 823.4487 | 215 | |||
Table 2 summarizes the relevant elements of the researcher’s ANOVA analysis. Line (1) represents the analysis of the variation of the mean azimuths between the take-off and landing flight mode factors (groups). Line (2) represents the analysis of the variation of the mean azimuths within each azimuth level (nose, beam, tail) for the take-off and landing factors. The line denoted as 1*2 represents a multiple comparison test for interactions between the means and all possible combinations of means.
DISCUSSION
Data Set
Previously expressed is the researcher’s expressed theory that certain combinations of independent missile launch parameters and aircraft flight regimes could significantly influence the simulated end-game outcome of the engagement. While the overall project studied many of these interactions and resultant outcomes, the specific relationship of the launch azimuth’s influence on the resultant magnitude of PCA miss distance was chosen to test the hypothesis.
PCA miss distance is a particularly powerful dependent variable. A similar dependent variable that could have been tested was simple missile hit or miss. However, due to its binary nature, many more replicates would have been required to achieve the desired confidence interval of 95%. Alternatively, PCA’s scalar (or nonbinary) nature allowed the hypothesis to be tested to the 95% confidence interval in significantly fewer replicates. This is a prime example of the effective use and benefit of DOE principals and is consistent with the researcher’s goal to improve the efficiency of traditional survivability assessments.
As summarized in Table 1, the launch parameters (independent variables) were aggregated into three populations, where all elevations and ranges were considered equally for launch azimuths that targeted generally about the tail, beam, or nose regions of one side of the subject aircraft. Missile engagement symmetry on the opposite side of the aircraft was assumed. PCA miss distances were considered for each of these populations with the aircraft in two different flight regimes: take-off and landing. A total of six launch parameter groups and their PCA miss distances were analyzed. Direct hits were ignored in this study.
Data Quality
A half-normal probability plot was generated on each data group to verify the quality of the data by evaluating the normality of the distribution of PCA—that is, the extent to which each resultant PCA outcome followed or deviated from the expected normal PCA distribution. The researcher’s purpose for these plots was to quickly visualize any peculiar outlying data points so that they could be examined closer for validity. If outliers were uncovered and found to be invalid due to equipment malfunction, operator error, or data collection difficulties, they could be rightfully disqualified as a valid data point. On the other hand, if outliers were not found to be invalid with cause, the influence of the outlying point or points in the analysis could be known and understood.
In Figure 1, the PCAs for each of the data groups follow the expected normal distributions quite satisfactorily. However, the plot representing the nose azimuth/landing configuration grouping revealed a single outlying point that deviated significantly from the expected norm. Upon closer examination, the point can be easily spotted in Table 1 (highlighted) as noticeably larger than the rest of the cohort. Based on a forensic examination of how the point was generated and collected, the researcher determined that the point was valid and thus could not be eliminated with cause.
In the interest of completeness, the researcher eliminated the point and regenerated the half-normal probability plots to see if agreement was improved. In Figure 2, it can be seen graphically that the outlying point’s skewing influence was noticeably reduced. The expected normal line became more aligned with the plotted data distribution of PCAs.
In the researcher’s judgment, however, keeping or eliminating this single point was of little consequence to the overall analysis. While the point visibly influenced the quality of 1/6th of the data set being analyzed, it was viewed that it would not influence the variation of the entire data set to any significant degree. The point was not eliminated because the validity of how it was measured and collected was intact.
Data Distribution In Figure 3, the simple distribution of PCA observations for each data group reveals visually the heavy influence of launch azimuth on the magnitude and variation of PCAs in both the take-off and landing flight regimes.
For tail engagements, the histogram in Figure 3 indicates virtually no difference between the take-off and landing flight regimes, with only slight variation in PCA magnitude. As the engagements come around to the beam and tail aspects, the variation in PCA magnitude becomes more pronounced. The distributions of the take-off PCA magnitudes were significantly flatter than the distribution of landing PCA magnitudes.
The entire data set was used to generate 95% confidence intervals about unweighted means in Figure 4. While the confidence limits about the mean for each data group are consistently spaced between them, the distribution of the PCA observations in the histograms in Figure 3 is not accurately reflected.
Conversely, data within each group were used to generate 95% confidence intervals about weighted means in Figure 5. In doing so, the confidence limits become sized differently between the data groups. When qualitatively compared to the histograms in Figure 3, the confidence intervals in Figure 5 become more representative.
Overall, Figures 4 and 5 show both the linear and quadratic interactions of the azimuth groups between the take-off and landing flight regimes. Mean PCA values about the tail aspects do not seem to be influenced by launch azimuth. However, mean PCA values about the beam and nose aspects indicate marked influence of launch azimuth. Figures 4 and 5 were the researcher’s first look at whether azimuth variation caused a difference in PCA magnitude and where the greatest variance within the data groups may lie.
Figure 6 depicts the range of minimum and maximum PCA values, the median PCA value, and the range of PCA values about the median for the middle 50% of PCA observations. Figure 6 further reinforces the influence of launch azimuth on the variation and magnitude of PCA.
Analysis Previously described is the variation and distribution of the means for two factors with three levels each. To test for significant differences between the means, the variances between them were inferentially analyzed using the ANOVA method.
Had the researcher limited the analysis to simply the variance between the azimuth means of the take-off and landing factors, a routine t-test would have sufficed. However, additional independent information about where and why differences (or features) existed could not be considered using this method alone. Instead, an ANOVA analysis permitted the partitioning of between-level and within-level sum-of-squares that characterized layers of independent information not afforded by the t-test.
In what would have been a comparatively more complex process, the researcher had the simplifying advantage of using Statistica™ to perform the ANOVA analysis on the chosen data set(s). With minimal researcher input, Statistica™ rapidly generated and tabulated (see Table 2) the ANOVA into its relevant statistical constituents: sum of the squares, degrees of freedom, mean squares, Fisher (F) statistic, and p-value.
Conventional statistics suggest that if F is large (F>>1.0), then differences exist. Likewise, if the supporting p-value is small (p<0.01), this suggests the differences are more probable than would be expected by mere chance alone. When comparing the azimuth means between the take-off and landing factors (Table 2, (1)), an F statistic of 24.50452 with a p-value of 0.000002 was calculated. When comparing the azimuth means within the nose, beam, and tail levels (Table 2, (2)), an F statistic of 30.45564 with a p-value of 0.0 was calculated. The post-hoc multiple comparison interaction (Table 2, (1*2)) between (1) and (2) resulted in an F statistic of 5.58383 with a p-value of 0.004338. The calculated F statistic was lower than the other two cases and supported by a higher p-value implying a clear interaction between less apparent data features.
Conventionally, the p-value would be limited (i.e., 0.01) so a critical F statistic could be determined (via lookup table) using the degree of freedom values. However, because the F statistics for all three cases were so overwhelmingly large supported by correspondingly low p-values, the researcher felt testing the calculated values of F against critical F statistic values found in a look-up table was not necessary. Adequate analysis of the null hypothesis could be performed as it stood.
CONCLUSIONS
The null hypothesis states that certain missile launch azimuths about the target aircraft do not contribute to significantly different magnitudes in the resultant simulated PCA miss distances to the aircraft. This hypothesis suggests that the variance of the PCA miss distance means between the factors and within the levels should be identical. However, based on the analysis performed, this was not the case. Supported by both descriptive and inferential statistical tests, the researcher observed unusually high variances in the mean PCA miss distances as a function of launch azimuth that supports the rejection of the null hypothesis. The conclusion is that launch azimuth heavily influences the simulated end-game outcome of the missile-to-aircraft engagement in terms of PCA miss-distance magnitude.
On the basis of descriptive statistics alone, the researcher might have correctly concluded that the distributions of the data as well as the obvious visual variances in the magnitude of the PCA miss-distance observations suggested a heavy dependence on launch azimuth. However, in the interest of completeness, quantifying the analysis further through an ANOVA could only lend credibility to what seemed obvious initially.
As suspected, the results of the ANOVA proved to be conclusive. The high F statistic values for cases (1) and (2), supported by virtually zero probability (p-value) that the variances in the PCA miss-distance means were due to chance, supported the researcher’s initial suspicion based on descriptive observations alone. The smaller F statistic and probability calculated in the multiple comparison tests did suggest one or more of the azimuth levels might be a greater contributor to the PCA variances observed. However, the F statistic was still much greater than a look-up critical F statistic based on the degrees of freedom, and the probability remained low. Ultimately, it was felt that the hypothesis had been adequately tested at this level of analysis even though there are evident grounds that deeper analysis is warranted. Recommendations to those ends are discussed as follows.
RECOMMENDATIONS
Specific to testing this hypothesis, the unusually high F statistics and low p-values imply highly probable, significant differences that support the researcher’s hypothesis. However, what are not revealed are the details of additional potential data features and interactions that the researcher suspects exist. The results only suggest a broad feature space within which more research could be performed. The introduction of more refined azimuth levels could serve to differentiate in greater detail specific contributing features/
interactions that were confounded by the generalized scope of the azimuth levels chosen for this study to protect the classification of the subject matter. Additionally, consideration of other launch parameters (e.g., range and elevation) may add dimension to the feature space of the data set, further refining the causal aspects of missile hit-point and miss-distance evaluations in general.
The initial results of this study have far-reaching implications for the advancement of aircraft survivability science. As asserted previously, the demand on the aircraft survivability research community to discover, understand, and offer mitigating survivability solutions is a challenging undertaking, and this challenge must be met more wisely and more innovatively through advanced technologies and methods.
Until recently, most survivability assessments or evaluations have been stuck in the rut that is open-air live fire verification testing. As systems have become increasingly more complex (and in turn more expensive), subjecting them to actual combat damage is not practical. It seems the advancement of M&S technologies and methods is the next logical progression in survivability science and should serve nicely as an economic solution with increasing influence in the survivability research community.
While this body of research was funded specifically to address the survivability posture of a particular airframe, it has served nicely as a platform for advancing the known techniques for doing so. The researcher had two stated objectives: establish a susceptibility baseline for an unprotected commercial-derivative large aircraft against a typical ground-launched missile threat and narrow the scope of follow-on vulnerability assessments to areas on the aircraft that have the highest vulnerability potential. Both were achieved using highly specialized HITL simulation and aircraft modeling techniques for a fraction of the cost of performing open-air live fire verification testing.
The M&S techniques are sound and are becoming more and more capable. However, verification and validation of these techniques remain significant issues. The credibility of the results is continually scrutinized and criticized. In as much as a great deal of effort has been poured into expanding the M&S capabilities in ACS, the researcher recommends all prospective practitioners to exert an equal amount of effort in verifying and validating their techniques to counter the certain criticism.
Although DOE has been a dominant player in manufacturing for some time, in Defense test and evaluation (T&E) it is a relative newcomer. DOE is a vastly different approach to traditional Defense T&E and thus has been a tough sell for most. Nonetheless, this researcher used DOE principles for the first time throughout this project and is convinced it is a more productive and less costly way forward for this type of work.
When directly compared to similar past studies conducted using traditional methods, the DOE studies produced more robust, informative results in fewer runs by almost half. Correspondingly, the schedule and thus cost were significantly reduced. The obvious advantages of practicing DOE principles notwithstanding, the researcher recommends that all survivability researchers incorporate the use of DOE in their future assessments and evaluations.