


Introduction
What happens when a hypersonic missile is launched from a Navy destroyer? Aside from the forthcoming damage effects and political fallout, there are a million complex physical interactions that take place right at the moment and place of the launch. One area of important study is the flow field around the launch system on the Navy destroyer to which it is integrated. Full-scale testing is an unrealistic method to understand such an environment for various reasons (e.g., cost, safety, resources, etc.). Therefore, we have conducted computational fluid dynamic (CFD) simulations to better characterize the flow field at the bow topside of a simplified model destroyer for the intended safe launch of conventional prompt strike (CPS) hypersonic missiles.
Recently, a numerical study characterizing the turbulent flow field of a simplified model having geometry and a Reynolds number resembling the USS Zumwalt was performed and revealed the existence of leading-edge vortical structures and a superstructure base vortical structure. The turbulent, integral-length scales of these vortical structures are of the order of the geometric diameter of a CPS missile and would interact with the missile during their initial launch phase, generating unfavorable aerodynamic side forces. These forces would potentially cause a perturbation in the initial trajectory of the missile as well as introduce excessive vibration and rubbing of the missile within its canister. An understanding of the turbulent flow and vortical structures in the bow region of the Zumwalt class destroyer will help identify regions of lowest disturbance where the multiple all-up canisters (MACs) tubes may be safely installed and launched. For this purpose, the influence of superstructure shape modification, depicting the Zumwalt class destroyer, on the bow flow field is also investigated.
Background
Research studies related to the flow field analysis of frigates and destroyers, including both realistic and simplified models like the SFS2 (simplified wind tunnel model for frigates) and ONRT (simplified wind tunnel model for the USS Zumwalt), have been directed toward turbulence characterization over the flight deck region [1–4]. Analysis of airwake turbulence over the flight deck is important to quantify pilot workload and handling qualities of helicopters while performing seaboard operations, including hovering, landing, and takeoff maneuvers. Active and passive control strategies have also been studied to reduce the impact of turbulence motions on handling qualities of the helicopters over the flight deck, significantly influencing the pilot workload [5].
CFD efforts have also focused on the flight deck region where the turbulence models have been validated against the wind tunnel results, performed at a reduced flow Reynolds number (Re), and compared to the full-scale prototype. Although geometric similarity is maintained, generally 1:200, 1:100, and or 1:60 in the wind tunnel tests, the dynamic similarity between the model and prototype was not achieved due to the limitation of experimental facility. This means that the flow ReH (based on free stream velocity and superstructure height) of the wind tunnel model differs from the prototype by approximately 2 to 3 orders of magnitude. However, to overcome this limitation, it has been observed that beyond ReH of 2 × 10⁴, the airwake characteristics over the flight deck region of frigates/destroyers are found to be ReH independent [6]. However, these scaling factors need to be incorporated on the prototype when using wind tunnel results. Currently, the experimental and numerical results of scaled down model are restricted to the flight deck region. Little or no attention has been given to the flow field in the ship’s Bow region, hence becoming the focus of the current research.
Characterizing the turbulent flow field of a full-scale unmodified, simplified model (SFS2) using CFD revealed the existence of the bow leading-edge vortical structures and vortical structure at the superstructure base (Figure 1). Since the geometric ratios, bow shape, and Re number of the simplified frigate model are very similar to the Zumwalt class destroyer, turbulent vortical structures are also expected in the bow region of the USS Zumwalt (or ONRT). As shown in Figure 1, the Navy has intended to integrate CPS hypersonic weapons on the Zumwalt class destroyer by replacing one or both gun mounts with the MACs [7]. These gun mounts are currently installed in the bow region. Research efforts addressing the bow region flow field are becoming more relevant for the intended safe launch of CPS hypersonic missiles. Therefore, it is necessary to estimate scales of turbulence, intensity, and turbulent kinetic energy (TKE) as well as the orientation of the vortical structures at the probable CPS missile locations on the bow of the USS Zumwalt. Understanding of these turbulent vortical structures will highlight potential interactions with the missiles during the initial launch phase by generating unfavorable aerodynamic forces and causing disturbances in the initial missile trajectory. The simulation results can help decision-makers select a favorable location for MAC installation.
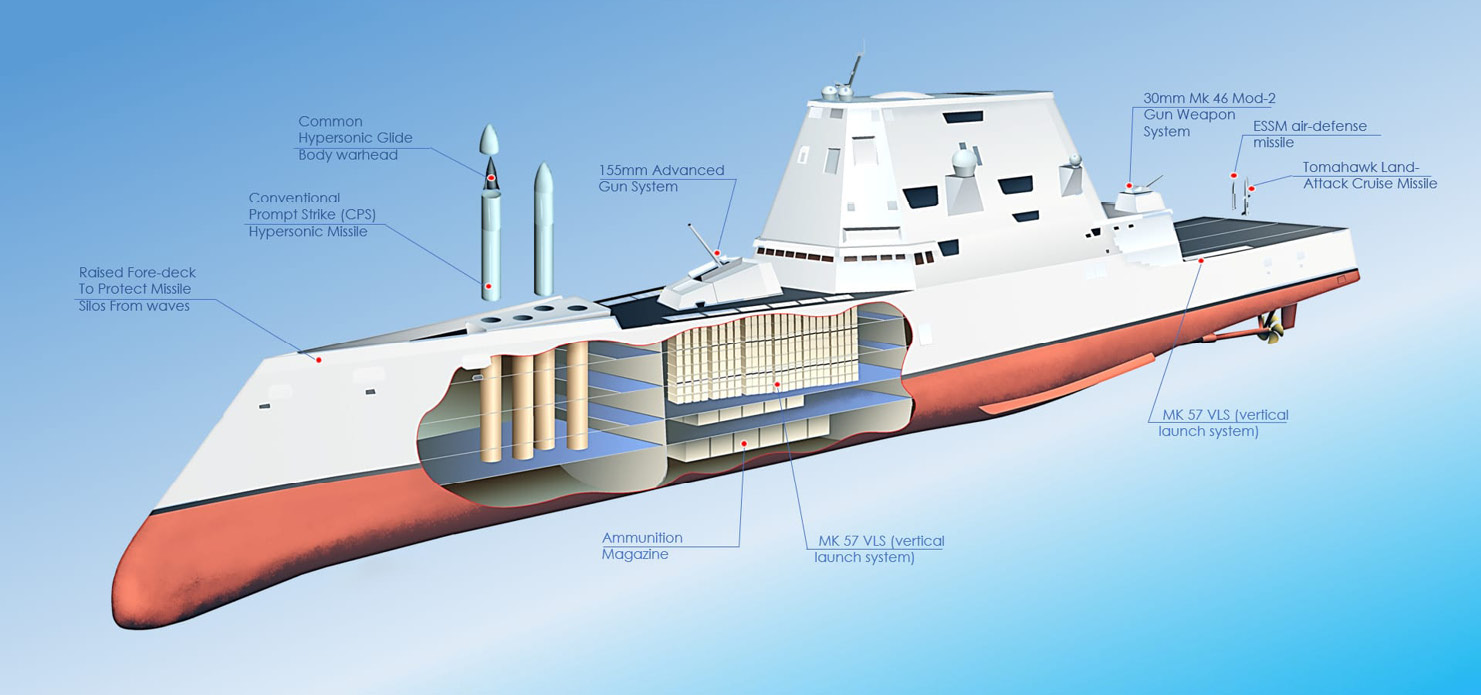
Figure 1. (Top) Proposed Location of the MAC Tubes on the USS Zumwalt [7], (Bottom) Identification of Bow Leading Edge and Base Vortices of the SFS2 [7], and (Insert) SFS2 Model Sketch [8].
To bridge this research gap, preliminary research is carried out to critically investigate the bow topside flow field without launching the missile. The idea is to understand the undisturbed or unmodified bow flow field first to help identify regions of least disturbance for installation and safe launch of CPS missiles. As a continuation of this research, the initial launch trajectory of the CPS missile under the influence of bow turbulence will be simulated at a later stage. For this purpose, the full-scale, simplified frigate model (SFS2) is analyzed numerically and validated with available experimental data. Since the bow geometric dimensions and configuration of SFS2 are like the ONRT, dynamic flow similarity is expected between these simplified wind tunnel models of frigates and the Zumwalt class destroyer. The geometric shape of the superstructures of the SFS2 and ONRT are different. Therefore, the forward face of the superstructure on top of the bow region of the SFS2 is modified to resemble the ONRT, and its impact on the bow flow is examined. (The unmodified SFS2 will be referred as the “Clean SFS2,” whereas modified superstructure geometry to resemble ONRT will be referred to as “Mod SS.”) Carrying almost 80% of the total TKE, the integral scales of turbulence at the probable CPS missile integration location are quantified, along with the distribution of turbulence intensity, kinetic energy, and vorticity at different streamwise locations along the bow. A comparative dynamic flow analysis between the Clean and Mod SS geometries of the simplified frigate model (SFS2) is also presented.
Numerical Setup
Methodology
The emerging trends in the literature suggest that scale-resolving turbulence models like the large eddy simulation (LES) and the detached eddy simulation and their variants perform better for the numerical simulation of unsteady and bistable airwake of SFS2 than the Reynolds-Averaged Navier-Stokes (RANS) turbulence models. Capturing the wake bimodality (i.e., switching the stable states of the bistable airwake) using a well-resolved LES turbulence model is computationally expensive but viable, as found in the relevant CFD studies of similar domains of airwake bistability concerning the Ahmed body (simplified model for car aerodynamics). The high computational cost for an LES simulation is a restrictive factor. Therefore, in this research, the embedded LES (ELES) turbulence model is used, which is a hybrid RANS/LES turbulence model based on a zonal approach in which the RANS and LES turbulence models are used in predefined zones. In most cases, the LES zone is declared as the region of interest, and this zone is placed inside a global RANS zone. Such a technique bridges the gap between the high computational cost requirement of the full LES approach and inadequacy of the RANS models for such unsteady flow simulations.
To perform the ELES simulation, an a priori simulation using the standard k-ε RANS model is performed. Using this precursor solution, the integral length scales (lo ~ k3/2/ε) of the turbulent structures in the flow field of SFS2 are estimated. Based on the minimum accepted value of the integral length scales, the mesh inside the LES zone is refined. The most important step in performing an accurate ELES simulation is designating the LES fluid zone inside a global RANS domain. In the ELES turbulence model, the LES turbulence model is used during the simulation only within the declared or predefined LES fluid zone, whereas the standard k-ε RANS turbulence model is used to simulate the flow field, thereby reducing the computational cost compared to performing an LES turbulence model in a complete fluid zone. As detailed in previous research [8, 9], four different cases were simulated wherein the RANS-LES interface was defined at a different streamwise location along the length of SFS2 geometry. This analysis [9] revealed that once the complete geometry of the SFS2 was placed inside the predefined LES fluid zone, the numerical results agreed with the experimental data set. The flowchart in Figure 2 indicates the steps performed in an accurate simulation of the SFS2 flow field using the embedded ELES turbulence model.
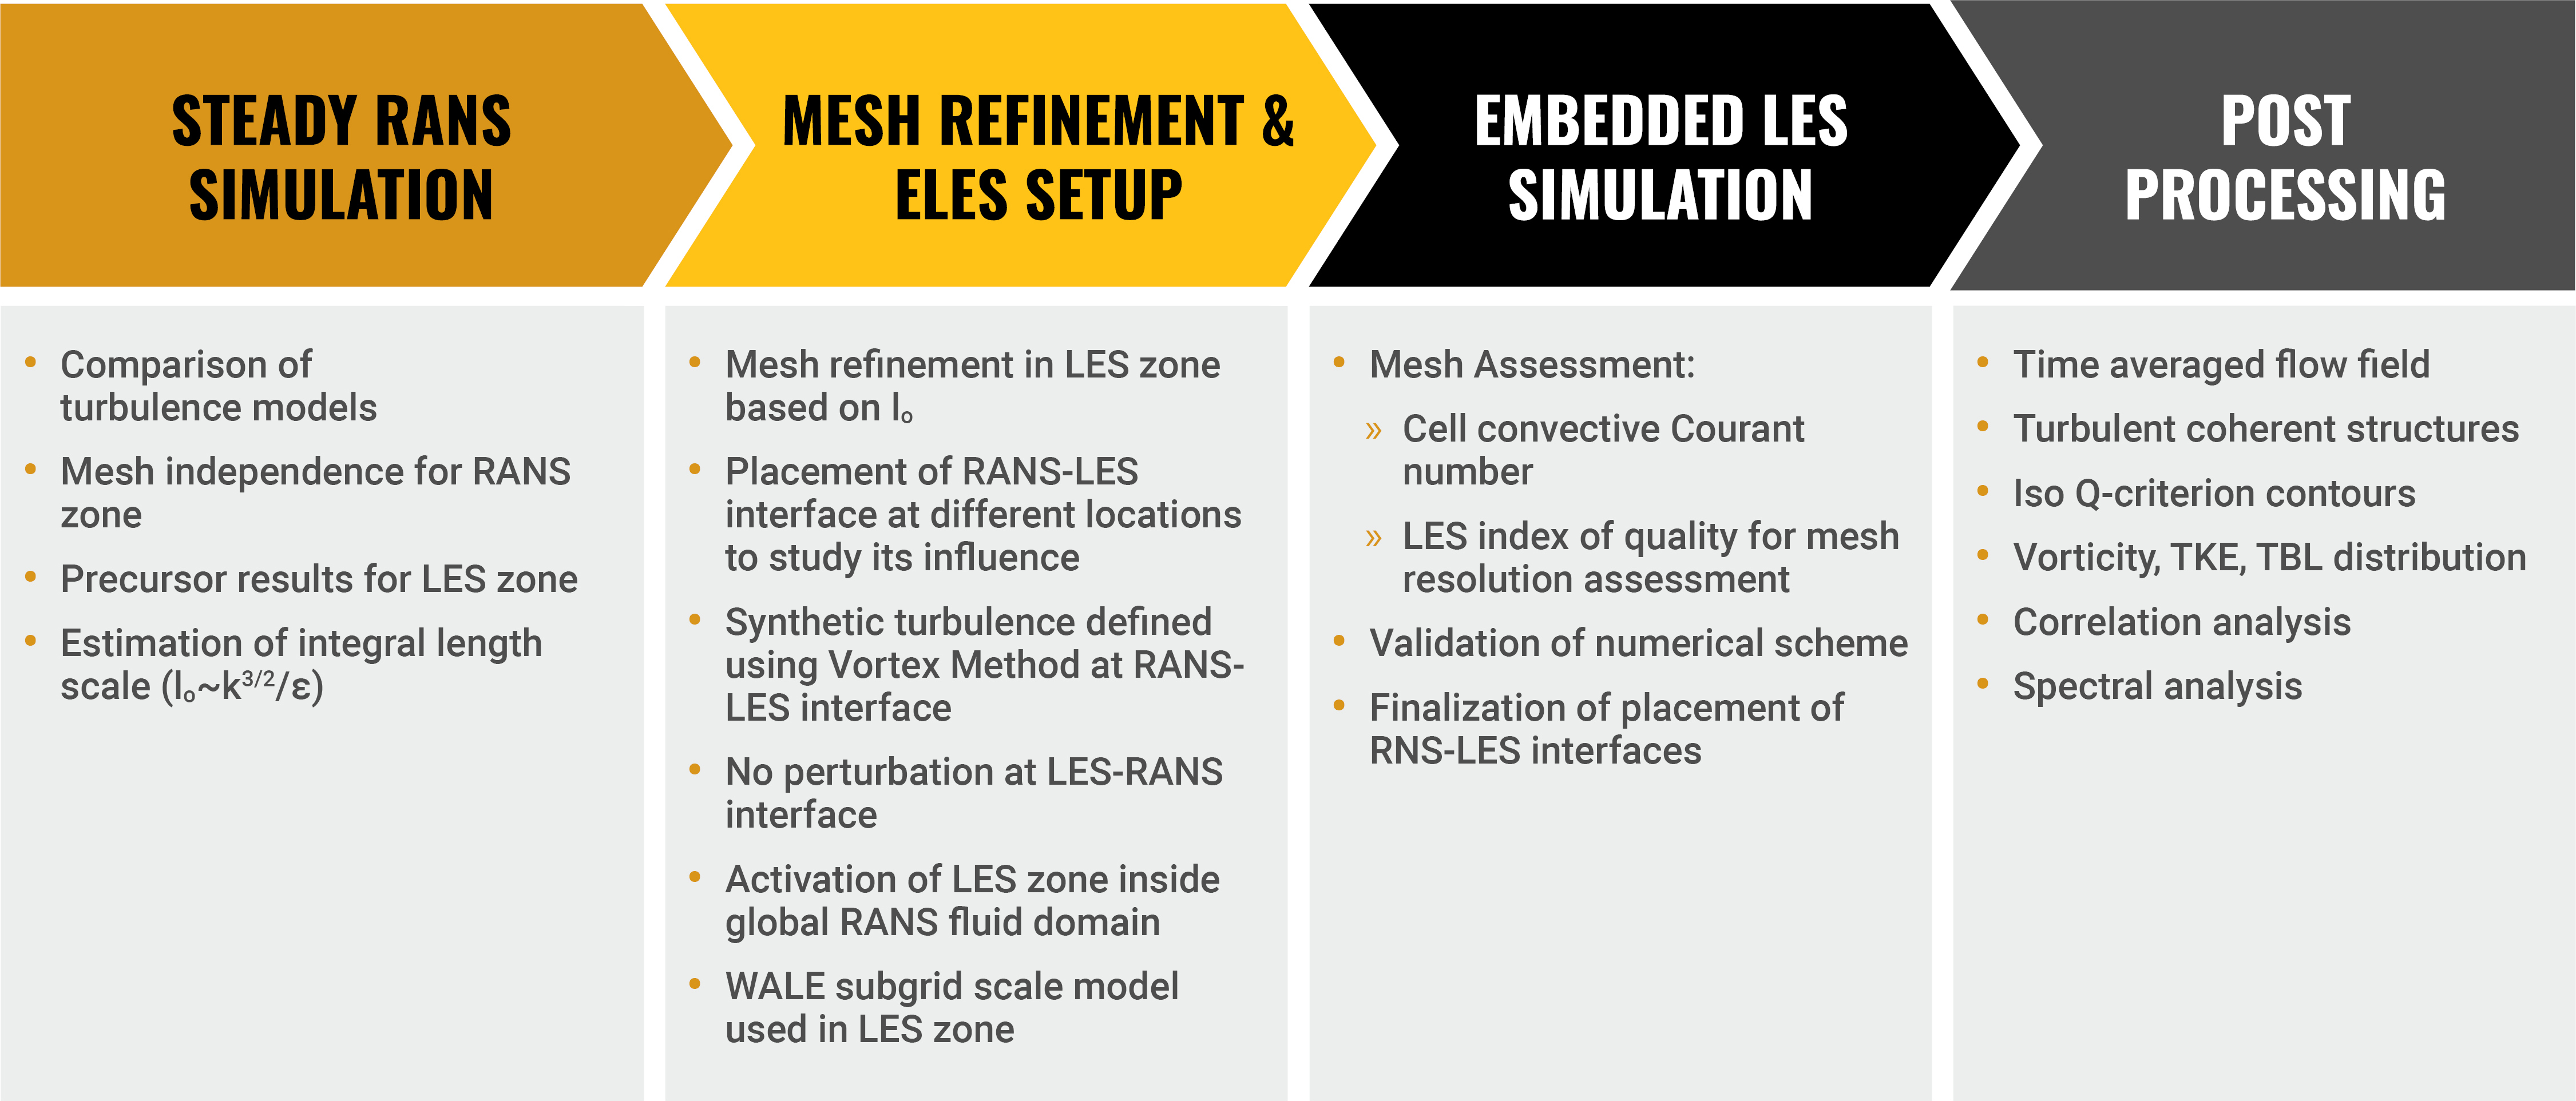
Figure 2. Flowchart of the Methodology Using the ELES Turbulence Model (Source: P. J. Disimile and S. Q. Zaheer).
Setting
To numerically simulate the flow field of the geometric version of the SFS2, a fluid domain is created around the vessel whose boundaries extend to 5L (L = length of SFS2) on both the starboard and port sides, and the inlet is defined as an arc having a radius of 5L from the bow. The outlet is placed at 6L from the stern, and the top boundary is located at 1L from the bottom surface. Velocity inlet and pressure outlet are used as boundaries. The surface of the SFS2 is defined as a wall boundary condition with a no-slip boundary condition, whereas the bottom surface of the domain is also defined as a wall with zero shear (Figure 3). The top surface is defined as a symmetric boundary condition. A structured mesh is generated on the surface of the SFS2 and then a prism layer with a maximum y+ value of less than 40 having 25 inflation layers. A zone of higher mesh resolution, termed as the inner zone, is created around the SFS2. The rest of the outer fluid domain is coarsely meshed; therefore, nonconformal mesh interfaces are generated between the inner and outer fluid zones. A uniform velocity of 40 kts (20.6 m/s) is defined at the inlet, which corresponds to ReH of 2.26 × 10⁷. An atmospheric pressure equal to 1 atm is defined at the pressure outlet. The air is treated as incompressible fluid, and a pressure-based solver is used with a second-order accurate discretization scheme for the momentum, turbulence quantities, and time. A simple pressure velocity coupling solver is used. The viscous boundary layer on the surface of the ship model is calculated using a standard wall function since the y+ value of the prism layer lies in the logarithmic (log) law region of the boundary layer. Given the Clean geometry of the SFS2 and the very high ReH flow, the prism layer can take on a relatively higher value of y+.
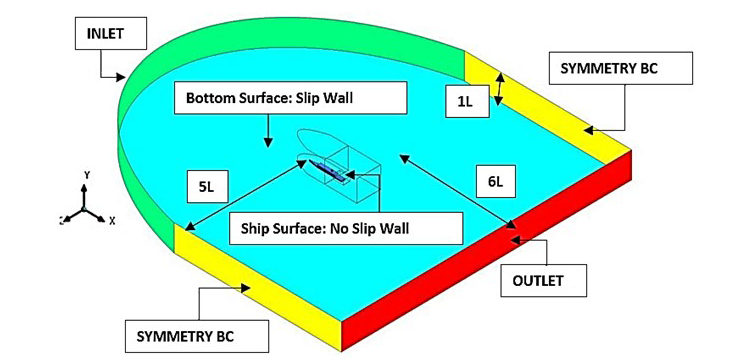
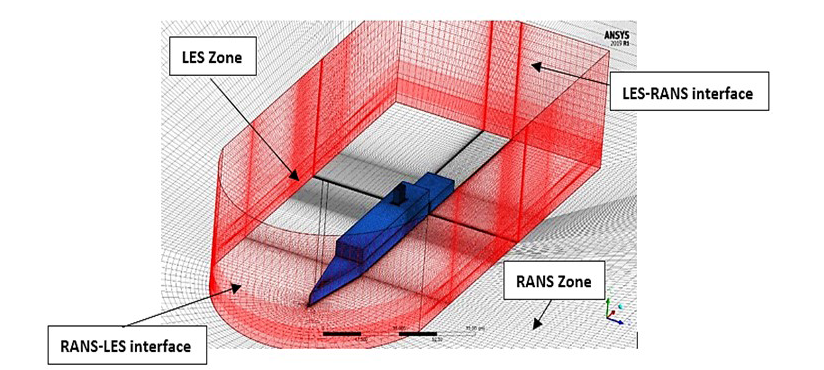
Figure 3. (Top) Meshed Fluid Domain With Boundary Conditions and (Bottom) Meshed Interfaces of the Embedded LES Fluid Domain With a Global RANS Domain (Source: P. J. Disimile and S. Q. Zaheer).
After the mesh refinement in the respective LES zone and based on the precursor RANS simulation, the LES zone is activated in the defined fluid zone and the solution setup is changed from steady to transient, with a time step equal to 100 μs. The transient ELES simulation is run for approximately two flow convective times before the unsteady flow statistics are collected for time averaging. The simulations are run for 35 seconds of physical flow time. Since the geometry of the SFS2 model is such that the separation of flow is governed by the sharp edges and steps rather than typical viscous boundary layers, the height of the viscous sublayer of the developed turbulent boundary layer is small. At such a high ReH, the placement of the first mesh node in the wall normal direction in the log law region is rationalized [10]. Using the y+ ≤40 in the LES zone renders the mesh unable to resolve the wall in the LES simulation, which would otherwise have required a very high computational cost. Therefore, to model the near-wall dynamics in the subsequent ELES simulations, a special subgrid scale wall model called the Werner-Wengle Model [11] is activated in Fluent 19.0 (from Ansys in Canonsburg, PA) in which the instantaneous velocity profile follows the law:
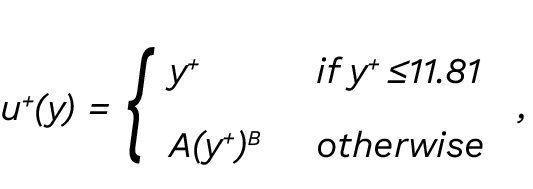
where A = 8.3 and B = 1/7. This approach makes it possible to place the first layer of the mesh in the logarithmic layer (i.e., the inertial subrange). Such an approach had been adopted by different researchers in the past, especially for separated flows like the Ahmed car body [12], high-rise building dynamics [13], and prediction of flow-induced noise [14]. The results were found to be in better agreement with the experimental data at reduced computational cost compared to performing a wall-resolved LES simulation. The grid in the LES zone for ELES, after refinement, results in a mesh cell count of 8.4 million in the LES zone and 1.4 million in the RANS zone.
Validation
The resolution of the turbulence having length scales of interest is a very important contributor for accurate simulation of the flow field using the ELES turbulence model. This resolution is achieved by numerical discretization of the fluid domain, i.e., mesh size. The assessment of the mesh resolution in the LES zone of the fluid domain is carried out using the LES index of quality (LES-IQ). The LES-IQ is a nondimensional number having values from 0 to 1, where values closer to 1 indicate a mesh resolution high enough to capture flow dynamics of the large-scale turbulence. The histogram of the distribution of this index inside the LES zone is plotted in Figure 4, which clearly indicates that almost 95% of the cell count has an LES-IQ index greater than 0.85. The Courant-Friedrichs-Lewy (CFL) number distribution inside the LES zone also indicates CFL<<1 in almost the entire fluid domain, suggesting an accurate time step size is chosen for the simulation.
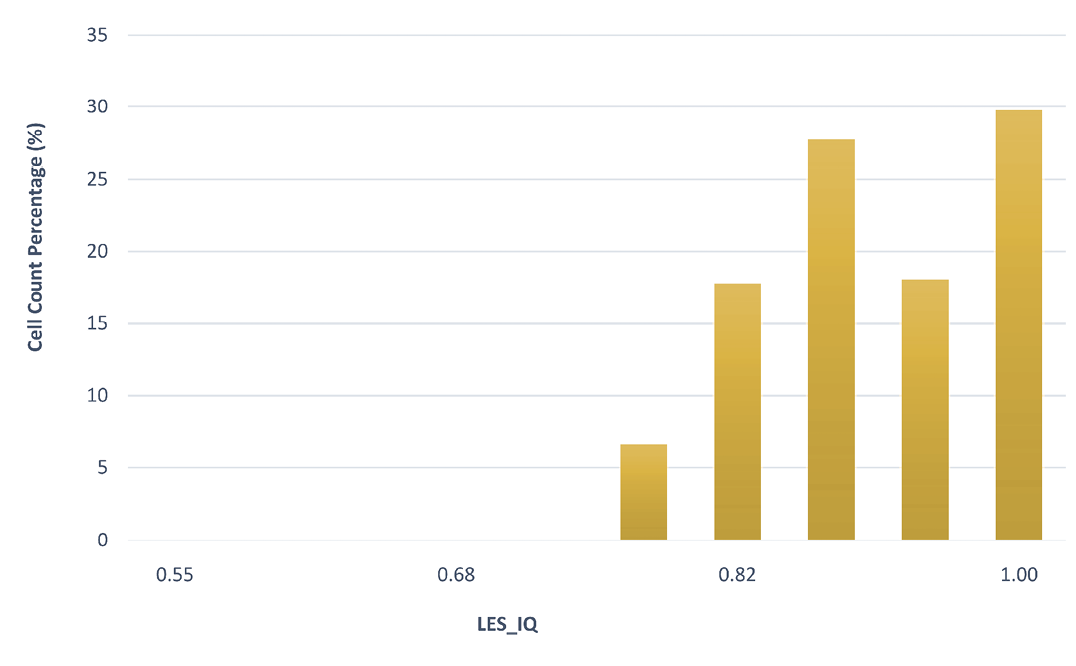

Figure 4. (Left) Histogram of the LES-IQ and (Right) CFL Distribution Within the LES Domain (Source: P. J. Disimile and S. Q. Zaheer).
To validate the numerical setup, the velocity profiles along the vertical lines at locations A–D are plotted (Figure 5). These results are compared with the experimental values obtained using fast response probes and particle image velocimetry techniques [1]. Although there is a mismatch in ReH between the numerical and experimental setup, the qualitative assessment of the velocity profiles obtained numerically reveals very good agreement with the experimental values and provides confidence in the simulations using the ELES technique. The asymmetry in the profiles of measurement locations A and D is also captured in the present research. A slight offset in the magnitude of CFD results is attributed to the fact that an atmospheric boundary layer was incorporated in the experiment, whereas a uniform velocity profile inlet is defined in the current simulations.
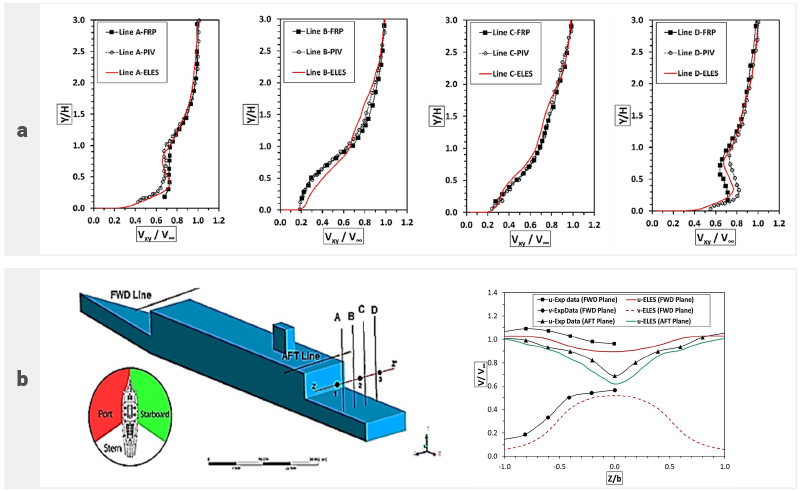
Figure 5. Comparison of Numerically Simulated Velocity Distribution at (a) Over the Flight Deck Along Vertical Lines A–D and (b) Along the Forward and Aft Lines Over the Superstructure, With the Experimental Dataset [1, 2].
To validate the flow field upstream of the flight deck, i.e., around the superstructure of the SFS2 geometry, a widely used data set obtained from the National Research Council-Canada [2] was used as reference. The streamwise and vertical velocity components are plotted at the forward and aft lines, and the results are compared with the experimental values. The difference between the ReH of the experiment and the current ELES simulation, i.e., O(2) less than the numerical simulation, as well as the use of reduced order scaling of the SFS2 geometry in experiments, allowed qualitative comparison only. The trends of the CFD velocity profiles closely follow the experimental values, thereby validating and revealing the efficacy of the current simulations. The literature suggests that there is ReH independence for the wake dynamics of bluff bodies above ReH = O(104). Hence, it is clearly visible from the plots (Figure 5a) that although there is an ReH mismatch, the nondimensional velocity distribution follows the same trend as the experimental data. However, the dataset recorded upstream of the airwake (Figure 5b) indicates that ReH independence is limited to the airwake dynamics only and does not apply to the upstream flow field.
Bow Flow Field Analysis
Vortex Dynamics
Once the numerical methodology and turbulence models were validated against the available experimental dataset for the simplified frigate model SFS2, the bow flow field was analyzed extensively. To better represent the geometric features of the USS Zumwalt, the superstructure of the SFS2 was modified by incorporating the slanted and trifaceted forward face of the superstructure using the Zumwalt’s geometric ratios (Figure 6). The flow field of the Clean and Mod SS geometries of the SFS2 is compared from here onward to understand the influence of superstructure modification on the bow flow field.
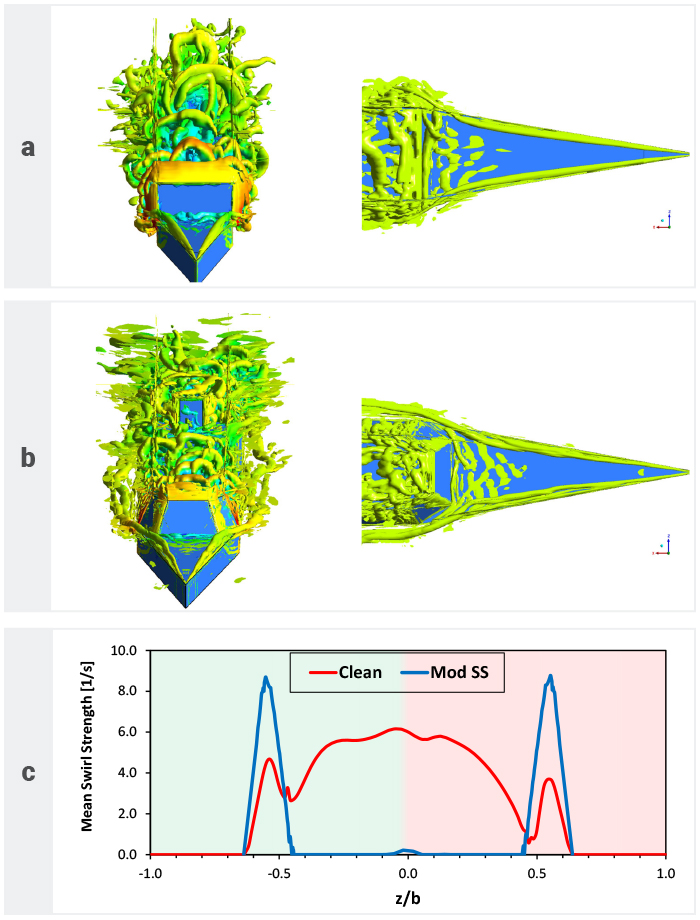
Figure 6. Isosurface Q-Criterion Plots of (a) Clean and (b) Mod SS Geometric Versions of the SFS2 and (c) Mean Swirl Strength Along the Core of Mean Base Vortex of Both Configurations (Source: P. J. Disimile and S. Q. Zaheer).
The instantaneous vortices generated on the bow region are visualized using the isosurface Q-criterion surface plots (Figure 6). On the bow region are the leading-edge vortices, attached to the top of the port and starboard sides is the bow, and a base vortex is generated at the foot of the superstructure’s forward face. These vortical structures influence the bow topside flow field. A detailed investigation revealed that the coherent base vortex was much stronger for the Clean geometry than the modified superstructure (Mod SS) case. Moreover, the leading-edge vortices also interacted with the base vortex upon reaching the forward face of the superstructure. This interaction is more constructive on the starboard side than the port side; thereby, the time-averaged vorticity of the base vortex becomes asymmetric across the midplane of the SFS2 geometry and biased toward the starboard side and can be observed by the mean swirl strength plotted along the core of the base vortex. The biasness of the mean swirl strength of the base vortex toward the starboard side is presented in detail in Zaheer and Disimile [8]. It has been observed that more or less constructive interaction of leading vortices with the base vortex is due to the rotation direction of these vortices. The base vortex and starboard side-edge vortex have clockwise rotation, whereas the portside-edge vortex rotates anticlockwise. It can also be observed that the mean base vortex of the Clean configuration is very strong near the midplane, as opposed to the Mod SS configuration. However, toward the edges of the bow, i.e., z/b = ±0.5, a higher swirl strength than the Clean SFS2 geometry is observed due to coherence and strength of the leading-edge vortices for the Mod SS configuration. The Mod SS configuration also has a symmetric mean swirl distribution.
The strength of the base vortex also influences the structure and size of the leading-edge vortices. This is because the base vortex generates a suction effect by entraining the incoming fluid; hence, a stronger base vortex would entrain more fluid than a weaker, incoherent one. This entrainment of incoming fluid would generate a suction effect on the topside of the bow. Therefore, the leading-edge vortices of the Clean geometry are observed to be larger than the Mod SS configuration. Moreover, referring to the topside views of the vortical structures (Figure 6a and b), the faceted and slanted forward face of the Mod SS enables the formation of leading-edge vortices like the conventional delta wing.
A primary (large) and secondary vortex system along the leading edges is generated. The secondary vortex is found to be attached to the leading edges, whereas the primary vortex traverses inward toward the midplane, similar to a typical delta wing vortex system. However, in the Clean geometry case, there is only one strong, coherent, vortical structure along the top edges of the bow. The clear disparity between the structure of leading-edge vortices of the two configurations supports the argument that the base vortex does influence the leading-edge vortices. These vortices in the Mod SS case remain coherent even after they travel downstream of the bow and onto the sides of the superstructure, whereas those of the Clean geometry break down once they leave the bow region.
Turbulence Characteristics
The potential installation of MACs carrying CPS hypersonic missiles on the USS Zumwalt would be accomplished by removing the existing two-gun mounts on the topside of the bow. These gun mounts are approximately positioned at X/Lb (Lb = length of bow) of 0.5 and 0.8 downstream distance from the front tip of the bow at the midplane (see probe locations B12 [front gun mount] and B9 [rear gun mount] in Figure 7a). Therefore, in this section and the subsequent section, the turbulence parameters and the included integral scales of turbulence are analyzed specifically at these locations for the Clean and Mod SS cases of the SFS2. The percentage root mean square (RMS) fluctuations in the streamwise, vertical, and lateral velocity components, i.e., urms, vrms, and wrms, are plotted across the width of the bow at stated streamwise distances. The mean TKE is also plotted along the same lines. These measurements are carried out at y/H = 0.25 from the surface of the bow.
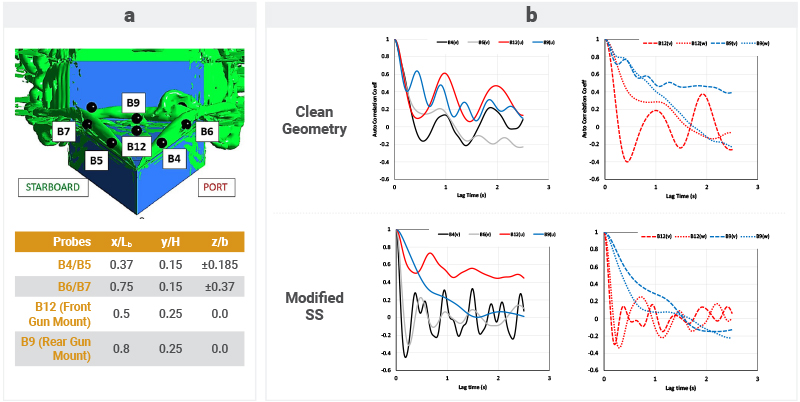
Figure 7. (a) Probe Locations for Measurement of Velocity Spectra and (b) Resultant Auto Correlation Analysis Using Different Velocity Components (Source: P. J. Disimile and S. Q. Zaheer).
Analyzing the distribution of the RMS velocity fluctuations across the width of the bow at two different streamwise locations reveals that overall, the magnitude of fluctuations is low for both the configurations. It is also observed that in the middle or the central region of the bow at both streamwise distances, i.e., X/Lb of 0.5 and 0.8, the fluctuations in the streamwise component of the velocity are higher than the vertical and lateral components for both configurations. Moreover, the fluctuations in the central region are higher for the case of Clean geometry than the Mod SS configuration. The magnitude of Urms fluctuations becomes stronger at 0.8X/Lb than 0.5X/Lb. However, toward the edges of the bow, contribution from the fluctuating vertical and lateral velocity components is stronger for the Mod SS than the Clean SFS2 configuration. This trend is attributed to the strong coherent leading-edge vortices of the Mod SS configuration. Likewise, the trend is duplicated in the distribution of the mean TKE across the bow region at two streamwise locations for both the configurations. From this analysis, it is suggested that the location of the rear gun mount experiences greater flow disturbances than the front gun mount location. Therefore, the front gun mount should be considered as a more favorable region for MAC installation because it experiences less turbulence.
Integral Scales of Turbulence
The autocorrelation of the velocity spectrum recorded at different locations on the bow region of the Clean and Mod SS SFS2 configurations is plotted in Figure 7 and compared to address the influence of the vortical system and configuration on the turbulent integral length scales of the eddies.
Probes B4/B5 and B6/B7 essentially capture the flow dynamics of the leading-edge vortices on the port and starboard sides of the bow. The B4/B5 probes, located upstream to the front gun mount location, influence the B12 probe, whereas B6/B7 probes predominantly influence the B9 (rear gun mount location) flow field. The vertical (v) velocity fluctuations in the near vicinity of the leading edges are dominant for both configurations (Figure 8). Hence, the auto correlation coefficient (rii) at the B4 and B6 probes is calculated using the v-velocity component. Since the trends of rii for corresponding starboard side probes are observed to be similar, they are not included. The correlation coefficient at the B12 and B9 probes is calculated using all three velocity components to analyze and investigate the dominant influence of leading-edge vortices. The first zero crossing of rii is taken as the criterion for assessing integral scales of turbulence at respective probe locations. For the B4 and B6 probes, the slope of the rii regarding lag time is observed to be higher for the Mod SS case than the Clean geometry, signifying the existence of a significantly smaller integral scale of eddies compared to the Clean geometry. Moreover, for both the configurations, the scales of eddies are larger for the B6/B7 probes than the B4/B5.
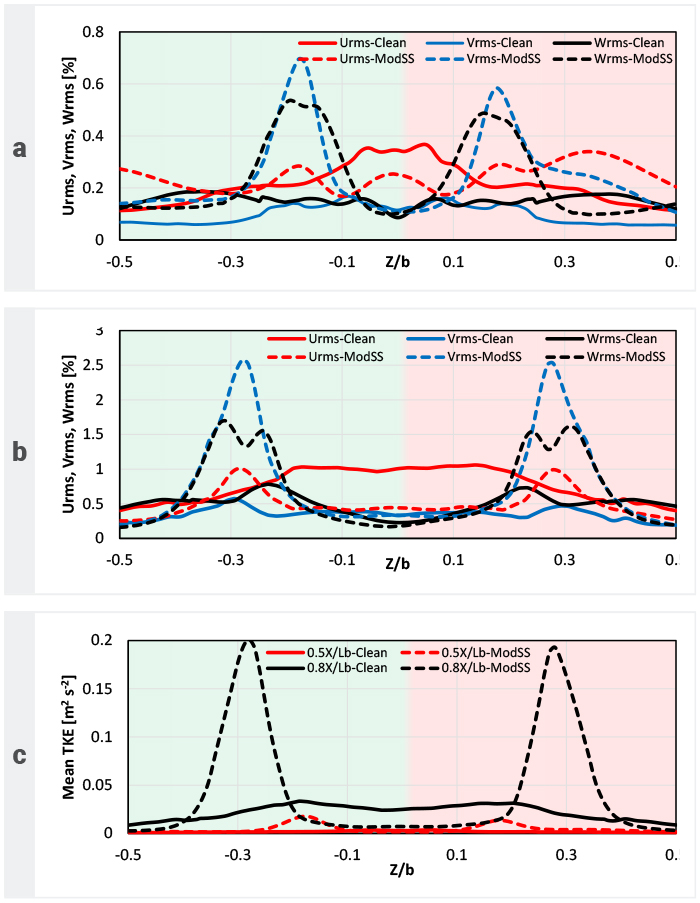
Figure 8. Distribution of Percentage RMS Values of the Turbulent Velocity Fluctuations at (a) X/Lb = 0.5, (b) X/Lb = 0.8, and (c) Mean TKE for the Clean SFS2 and Mod SS Cases (Source: P. J. Disimile and S. Q. Zaheer)
The plot of rii for B4 probe measurement of the Mod SS configuration exhibits secondary periodic peaks that affirm the stated argument of existing secondary vortices along the leading edge of the configuration, which are missing for the Clean geometry. Owing to relatively larger-scale turbulent eddies at the leading edge of the Clean geometry configuration, their influence is pronounced in the rii spectrum of gun mount probes, as exhibited by periodic reenergization of the curve before it crosses the zero rii line. This means that the turbulent eddies at the front and rear gun mount probes of the Clean geometry configuration are periodically reenergized by the leading-edge vortices.
The input of TKE from the leading-edge vortices influences the streamwise velocity spectrum at the B12 and B9 probes. However, for the Mod SS configuration, the flow field at these probe locations is less influenced by the leading-edge vortices due to their smaller scales. The integral scales of turbulent eddies are larger for the rear gun mount probe location than the front one for both configurations. Therefore, the front gun mount should be considered as a more favorable region for MAC installation and safe launch of CPS missiles.
Conclusions
This article explores the research gaps in the turbulent flow field and airwake characterization of the simplified model frigate/destroyers (i.e., an in-depth analysis of turbulence and associated vortical structures on the bow region of the simplified frigate model like the SFS2). The investigation of the bow topside flow field becomes pivotal for possible integration of MACs carrying CPS hypersonic missiles on the bow of the USS Zumwalt by replacing existing gun mounts. In this research, the bow flow field of the Clean and modified superstructure Mod SS (resembling ONRT) configurations of the SFS2 is analyzed and compared to predict the influence of superstructure modification on turbulence and vortical structures. It has been observed that the system of turbulent vortices, including the leading-edge vortices and base vortex, highly influences the bow topside flow field. Moreover, the base vortex for the Mod SS case was found to be significantly weaker than the Clean configuration. Therefore, its influence on the upstream leading-edge vortices is negligible. The analysis of turbulent intensity distribution, TKE, and the integral scales of turbulence reveals that the front gun mount is a favorable location for MAC installation as opposed to the rear one since it is located within a region of relatively higher turbulence; thereby, an adverse influence during initial launch trajectory of CPS missile is expected. 
References
- Rosenfeld, N., K. Kimmel, and A. J. Sydney. “Investigation of Ship Topside Modeling Practices for Wind Tunnel Experiments.” In 53rd AIAA Aerospace Sciences Meeting, p. 0245, 2015.
- Zhang, F., H. Xu, and N. Ball. “Numerical Simulation of Unsteady Flow Over SFS 2 Ship Model.” In 47th AIAA Aerospace Sciences Meeting Including the New Horizons Forum and Aerospace Exposition, p. 81, 2009.
- Dhuree, S., J. Gordon Leishman, E. Gnanamanickam, and Z. Zhang. “Time-Resolved Ship Airwake Measurements in a Simulated Atmospheric Boundary Layer.” Journal of Aircraft, vol. 58, no. 3, pp. 624–649, 2021.
- Zhu, N., Z. Zhang, E. Gnanamanickam, and J. G. Leishman. “Dynamics of Large-Scale Flow Structures Within Ship Airwakes.” In AIAA SCITECH 2022 Forum, p. 2532, 2022.
- Forrest, J. S., and I. Owen. “An Investigation of Ship Airwakes Using Detached-Eddy Simulation.” Computers & Fluids, vol. 39, no. 4, pp. 656–673, 2010.
- Healey, J. V. “Establishing a Database for Flight in the Wakes of Structures.” Journal of Aircraft, vol 29, no. 4, pp. 559–564, 1992.
- Sayler, H. M. “Hypersonic Weapons: Background and Issues for Congress.” Congressional Research Service, 2022.
- Zaheer, S. Q., and P. J. Disimile. “Simulation of SFS2 Using Embedded LES: Part-II Understanding the Asymmetry in Bistable Airwake at Zero Yaw.” Ocean Engineering, vol. 272, p. 113838, 2023.
- Zaheer, S. Q., and P. J. Disimile. “Simulation of Simplified Frigate Using Embedded LES Turbulence Model: Part-I Validation and Turbulence Scales.” Ocean Engineering, vol. 249, p. 110764, 2022.
- Menter, F., A. Hüppe, A. Matyushenko, and D. Kolmogorov. “An Overview of Hybrid RANS–LES Models Developed for Industrial CFD.” Applied Sciences, vol. 11, no. 6, p. 2459, 2021.
- Werner, H., and H. Wengle. “Large-Eddy Simulation of Turbulent Flow Over and Around a Cube in a Plate Channel.” In Eighth Symposium on Turbulent Shear Flows, Munich, Germany, 1991.
- Hesse, F., and A. S. Morgans. “Simulation of Wake Bimodality Behind Squareback Bluff-Bodies Using LES.” Computers & Fluids, vol. 223, p. 104901, 2021.
- Masoumi-Verki, S., P. Gholamalipour, F. Haghighat, and U. Eicker. “Embedded LES of Thermal Stratification Effects on the Airflow and Concentration Fields Around an Isolated High-Rise Building: Spectral and POD Analyses.” Building and Environment, vol. 206, p. 108388, 2021.
- Lane, G., P. Croaker, and Y. Ding. “Embedded Large Eddy Simulation Method for Predicting Flow-Induced Noise.” In Proceedings of Acoustics, vol. 10, no. 13, 2019.
Biographies
Peter Disimile (“Dr. D.”) is an associate professor at the University of Cincinnati and a subject matter expert on fluid thermal issues involving fire/explosion events, specifically those related to aerospace and vehicle survivability. He led numerous programs for the U.S. Air Force 96th TG Aerospace Survivability and Safety Flight as a staff scientist. He was the primary investigator on several programs such as shock/blast wave generation/propagation, fuel slosh, effects of fuel inerting, hot surface and pyrotechnic ignition of jet fuels, assessment of next generation fire suppressants, fire dynamics in a simulated aircraft environment, live fire testing, HRAM, and engine nacelle vulnerability. He has been instrumental in developing a lithium battery fire protection system with the U.S. Navy Surface Warfare Center. He has published nearly 200 papers on airflow and heat transfer phenomena, especially focusing on survivability issues, and has two fire protection system patents. Dr. D holds a B.S. and M.S. in engineering science from SUNY at Stonybrook and a Ph.D. in mechanical engineering from Michigan State University.
Syed Qasim Zaheer is a research associate for the University of Cincinnati’s Fire and Explosion Science & Technology Research Group, where he focuses on turbulence characterization of bluff bodies and ship airwakes and the aerodynamic design of a low-cost supersonic wind tunnel. He holds a B.E. in aerospace engineering from the National University of Sciences and Technology in Pakistan and an M.S. in fluid mechanics from Air University in Pakistan. Mr. Zaheer is pursuing his Ph.D. at the Department of Aerospace Engineering, University of Cincinnati.