

an email newsletter released every month highlighting the latest articles, events, technical inquires, and voices from the community
Weapon System Integration Cost Analysis

Posted on April 2, 2018 | Completed on March 1, 2016 | By: Scott E. Armistead
What are typical integration costs for new missile/weapon systems, and how do they compare to integration costs when upgrading existing systems?
The Defense Systems Information Analysis Center (DSIAC) was tasked with supplying data and analysis of typical platform integration costs for a missile/weapon system, to compare the potential cost of a new weapon versus that of an upgraded existing weapon. DSIAC noted that detailed weapon/platform integration costs are difficult to quantify, especially for various phases of a program (which may overlap). DSIAC also noted that leveraging ongoing efforts for previous phases may not be uniformly reported across various Armed Services and weapon system program offices, and/or they may not be reported uniformly from year to year. Instead, with concurrence from the requester, DSIAC researched U.S. Government reports detailing research, development, testing, and evaluation (RDT&E) and production costs for various major weapon systems and other cost estimating relationship (CER) studies; models for weapon system integration costs vs. weapon system complexity to developed notional RDT&E; and system integration cost curves vs. weapon system complexity. The reports were used as a simplified gauge to estimate similar costs for new system RDT&E and integration. Copies of the reports and studies were supplied to the inquirer. Additional reports that provided insight into the difficulties of and issues within cost estimating for major weapon systems were also provided.
1.0 Introduction
Defense Systems Information Analyses Center (DSIAC) staff with expertise relevant to the inquiry identified that detailed weapon/platform integration costs are difficult to quantify, especially for various phases of a program. These phases may overlap or leverage ongoing efforts for previous phases or other programs, which may not be uniformly reported across various Services and weapon system program offices or be reported uniformly from year to year. However, there are several yearly U.S. Government reports that attempt to provide a consolidated picture of the research, development, test, and evaluation (RDT&E) and production costs by major weapon systems. DSIAC staff provided sample information for weapon system RDT&E costs as the basis for a discussion to better understand what information would be helpful to make a proper analysis.
DSIAC staff also reviewed recent releases of reports from the Office of the Under Secretary of Defense Comptroller (OUSD(C)) on program acquisition costs by a weapon system developed as part of the yearly U.S. Department of Defense (DoD) fiscal year (FY) budget request [1–7]; the U.S. Government Accountability Office’s (GAO’s) annual report to Congressional Committees on assessment of DoD weapon system acquisitions during the years 2006–2015 [8–17]; and information on cost-estimating relationship (CER) models for weapon system integration costs used to help implement acquisition cost-reduction measures.
The author of this report, Scott Armistead, is Level III certified in DoD Acquisition and Test & Evaluation. He served for nearly 20 years as a U.S. Government Test Engineer, Program Engineer, Program Manager, and Technical Advisor for munitions developmental, operational, and Live-Fire testing organizations and Joint Program Offices developing programmatic, testing, and cost-estimating documentation for all phases of the weapon system acquisition life cycle. These systems included numerous Acquisition Category I, II, III, and IV Air Force, Army, and Navy programs.
2.0 OUSD Reports
Within the OUSD publications on program acquisition costs for weapon systems, one section is specifically devoted to missiles and munitions. For example, the FY2016 publication [7] covers the following weapon systems:
- Advanced Medium Range Air-to-Air Missile (AMRAAM).
- Air Intercept Missile-9X (AIM-9X).
- Joint Air-to-Surface Stand-off Missile (JASSM).
- Joint Direct Attack Munition (JDAM).
- Small Diameter Bomb (SDB).
- Hellfire.
- Javelin.
- Guided Multiple Launch Rocket System (GMLRS).
- Evolved Sea Sparrow Missile (ESSM).
- Rolling Airframe Missile (RAM).
- STANDARD missile family.
- Tactical Tomahawk.
- Trident II.
- Offensive Anti-Surface Weapon (OASuW).
- B61 Tail Kit Assembly (TKA).
Examples of the program acquisition costs and charts are shown in Figures 1 and 2. As seen in Figures 1 and 2, RDT&E costs can be broken out for the current and the past 2 years; however, these costs may be comingled funding for various phases of efforts and upgrades as funding is only for this specific period, not totaled to date or estimated to completion. Also, note the changes in the FY2014 and FY2015 cost and quantity numbers, shown in Figures 1 and 2. DSIAC would most likely have to go to the OUSD and/or the Program Office for each weapon system to get a clear breakout of overall totals to date and estimation to completion. This type of detailed data would be regarded as highly sensitive by each organization, difficult to obtain, and would be beyond the scope of a standard TI. The OUSD reports on program acquisition cost by weapon system are available online [18].
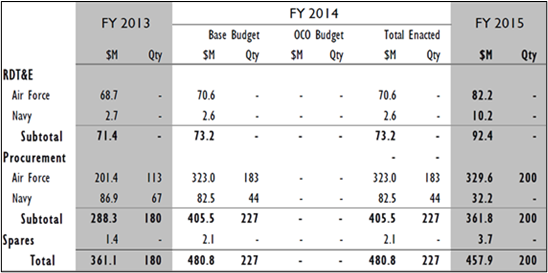
Figure 1: The 2015 Program Acquisition Costs for the AMRAAM [6].
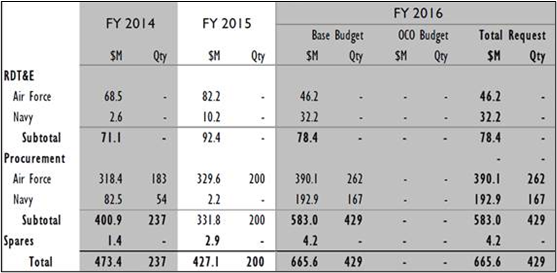
Figure 2: The 2016 Program Acquisition Costs for the AMRAAM [7].
3.0 United Kingdom Ministry of Defence (UK MOD) CER Models of Weapon Systems
There have been significant efforts to quantify weapon system integration costs to create CER models to help implement acquisition cost-reduction measures. For instance, the UK MOD Defence Equipment and Support group has been working on developing CER models based on Paveway IV, Brimstone, Future Air-to-Surface Guided Weapon (FASGW), Storm Shadow, Advanced Short Range Air-to-Air Missile (ASRAAM), and AMRAAM (lower to greater complexity) integration on the Harrier, Wildcat, Tornado, Typhoon, and F-35 platforms (again, lower to greater complexity). Table 1 shows the complexity levels of these weapon systems as determined by CER models.
These weapon systems were designed in the 1980s and 1990s and entered production in the 1990s and 2000s (Paveway IV was the last of them to enter production in 2008), with the exception of the Future Anti-Surface Guided Weapon (Light) (FASGW(L)) or Lightweight Multi-role Missile, and FASGW (Heavy) (FASGW(H)) or Venom, which were scheduled to enter production in 2016 and 2020, respectively [19].
Table 1: UK MOD CER Model Complexity Assessments of Weapon Systems [19]
| Platform |
Weapon System |
Complexity Level |
|||
| Platform | Weapon | Environment | Average | ||
| Harrier | Paveway IV | 1 | 1 | 1 | 1 |
| Harrier | Brimstone | 1 | 2 | 1 | 1.3 |
| Wildcat | FASGW(H) | 1 | 2 | 1 | 1.3 |
| Wildcat | FASGW(L) | 1 | 4 | 1 | 2 |
| Tornado | Brimstone | 2 | 2 | 2 | 2 |
| Tornado | Stormshadow | 2 | 2 | 2 | 2 |
| Tornado | ASRAAM | 2 | 2 | 2 | 2 |
| Tornado | AMRAAM | 2 | 4 | 2 | 2.7 |
| Typhoon | Paveway IV | 4 | 1 | 4 | 3 |
| Typhoon | ASRAAM | 4 | 2 | 4 | 3.3 |
| Typhoon | Stormshadow | 4 | 2 | 4 | 3.3 |
| Typhoon | SPEAR C2 | 4 | 4 | 4 | 4 |
| Typhoon | Meteor | 4 | 4 | 4 | 4 |
| Lightning (JCA) | Paveway IV | 4 | 1 | 4 | 3 |
| Lightning (JCA) | Meteor | 4 | 4 | 4 | 4 |
A model with uncertainty bounds from the UK MOD’s 2013 brief on progress in quantifying weapon system integration costs to that time is shown in Figure 3. The complexity rating is a combined average of subject matter expert assessments for the relative complexity of the weapon system, integration platform, and environment [19].
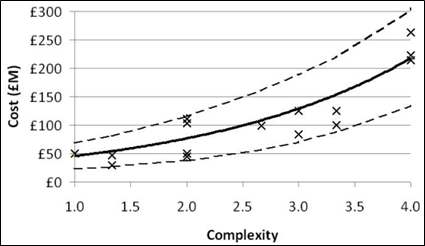
Figure 3: UK MOD CER Model of Integration Costs (2007 £M) for Various Missile and Bomb Weapon Systems Onto Various Aircraft Platforms [19].
4.0 RAND Study on Historical Cost Estimating Relationships and Cost Reduction Initiatives for Military Aircraft and Air-Launched Guided Weapons
In 2004, RAND performed a study like that of UK MOD’s for the purpose of improving the tools used to estimate the costs of future weapon systems. The study focused on recent technical, management, and government policy changes that affect cost by examining the effects of changes in the test and evaluation process used to evaluate military aircraft and air-launched guided weapons to include the AIM-9X, AMRAAM, JASSM, JDAM, Joint Standoff Weapon (JSOW), sensor fuzed weapon (SFW), Standoff Land-Attack Missile-Expanded Response (SLAM-ER), Tomahawk, and Wind-Corrected Munitions Dispenser (WCMD), which also provides some information on contractor system test and evaluation (ST&E) costs [20]. Portions of the study look at contractor ST&E costs and present a CER plot related to these costs to include Contractor ST&E total cost, ground testing cost, static and fatigue testing cost, flight testing cost, and other testing costs. The data and models used to support the RAND analysis would likely be useful in answering the question at hand; however, the openly available reports and briefings from the analysis tend to focus on development of the models and generally only contain samples of cost data used to develop the models. Acquiring the detailed data and approval for release would be beyond the scope of a standard TI response.
5.0 GAO Reports
The GAO published reports to Congress also provide an assessment of total RDT&E and production costs to date, as well as projected costs to completion (though not always for the latter). The report information is usually program block-/phase-specific. However, it may not be integration platform specific; data presented may be for integration onto multiple platforms (i.e., the JASSM onto F-15, F-16, and B-52 aircraft all rolled into single cost numbers). Though the data may not provide all the details and granularity desired, they are relatively easily obtained and will be used as the basis for this response [8–17]. Figures 4 and 5 show examples from the GAO FY2014 and FY2015 assessments for the AIM-9X Block II missile, respectively.
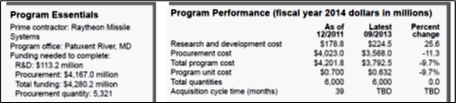
Figure 4: GAO FY2014 Program Performance Assessment for the AIM-9X Block II Missile [16].
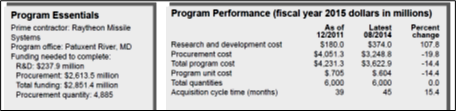
Figure 5: GAO FY2015 Program Performance Assessment for the AIM-9X Block II Missile [17].
In Figures 4 and 5, note the large increase in projected funding needed to complete research and development. The FY2015 report cites a 65% increase due to program deficiencies. Year-over-year increases are common across all programs due to deficiencies, new capability requirements, software and hardware modifications, modernization, etc., further complicating the determination of true total RDT&E costs [17]. The GAO reports on assessment of selected weapon programs can be found on their website by searching for “defense acquisition assessment.” Additionally, the GAO report “Defense Acquisitions: Better Approach Needed to Account for Number, Cost, and Performance of Non-Major Programs” provides supplementary insight on the subject [21].
Table 2 provides data for consolidated RDT&E costs for weapon systems integrated onto aircraft platforms by date of reported costs from the FY2006 to FY2015 reports (the latest reported data are used). The comparison of weapon systems, such as the JASSM to JASSM-Extended Range (ER) and SDB I to SDB II, provides good insight into the spectrum of RDT&E costs for next increments/blocks, with JASSM-ER being similar to a P3I effort and SDB II being almost an entirely new development effort. JASSM-ER shares approximately 70% common hardware and 95% common software with the original JASSM, and its mission and capabilities remain relatively similar, except for providing additional range for launch outside the enemy’s air defenses. As expected, RDT&E costs for the incremental development ($363 M) are significantly less than those for development of the original weapon system ($1,422 M). Conversely, the SDB II provides greatly increased capabilities (global positioning system [GPS]/inertial navigation system [INS], a trimode radar/infrared/laser seeker, and airborne and ground data links to allow engagement of both fixed and mobile targets in adverse weather conditions) over the original SDB I (GPS/INS-only guidance). As expected in this case, the RDT&E costs for SDB II ($2,209 M) are significantly more than those for the original SDB I ($511.3 M) [8–17].
Tables 3 and 4 provide similar data for weapon systems integrated onto land and ship platforms and for Ballistic Missile Defense System (BMDS)-related weapon systems, respectively. Many times, the RDT&E costs for these systems may or may not be rolled up into the RDT&E cost numbers presented in the report because the systems include other sensors, command and control (C2), fire control, and other equipment. All costs are escalated to FY2015 dollars using U.S. Consumer Price Index (CPI) data as provided in the Appendix.
Table 2: Estimated RDT&E Costs for Major Weapon Systems Integrated Onto Aircraft Platforms [8–17]
| Weapon System | Integration Platform(s) | Weapon Qty |
RDT&E to Date
($M) |
Est. RDT&E
to Complete |
Est. RDT&E Total ($M) |
Est. RDT&E
Total |
Est. RDT&E
per Item |
As of Date |
| SDB Increment I (SDB I) | A-10, B-52, B-1B, B-2, B-52, AC-130W, F-15E, F-16, F-22A, F-35 | 23,842 | 384.2 | 51.2 | 435.4 | 511.3 | 21.4 | Dec 04 |
| JASSM[1] | F-15, F-16, B-52 | 5,006 | 1,317.2 | TBD | 1,317.2 | 1,422.7 | 284.2 | Aug 09 |
| AGM-88E Advanced Anti-Radiation Guided Missile (AARGM)[2] | F/A-18, EA-18G | 1,767 | 722.2 | 0.0 | 722.2 | 747.9 | 423.3 | Jun 11 |
| OASuW Missile | F-18, B-1 | 110 | — | 1,189.6 | 1,189.6 | 1,189.6 | 10,814.5 | Aug 14 |
| Joint Air-to-Ground Missile (JAGM)[3] | AH-64, AH-1Z, OH-58, MH-60H/S, MQ-1C | 20,492 | 195.0 | 774.7 | 969.7 | 969.7 | 47.3 | Aug 14 |
| SDB Increment II (SDB II) |
F-15E, F-16, F/A-18E/F, F-22A, F-35, B-1B, B-2, B-52, A-10, MQ-9 | 17,163 | 1,688.4 | 521.0 | 2,209.4 | 2,209.4 | 128.7 | Aug 14 |
| JASSM-ER[4] | F-15, F-16, B-52 | 2,877 | 298.2 | 65.2 | 363.4 | 363.4 | 126.3 | Aug 14 |
| AIM-9X Block II Air-to-Air Missile | F-15, F-16, F-18, F-22A, F-35 | 6,000 | 374.0 | 237.9 | 611.9 | 611.9 | 102.0 | Aug 14 |
[1] This is the last reported RDT&E amount when both JASSM and JASSM-ER were assessed together, as they had over 70% commonality in parts. RDT&E amounts for only JASSM were not provided in the GAO reports.
[2] Earlier procurement called for 1,842 items (a 4.1% decrease), which could have resulted in increased per item RDT&E costs.
[3] The program was restructured in early 2012. No RDT&E data prior to then were provided for accomplished prototyping efforts in an FY15 report [17], but an FY13 report [13] lists $195M estimate for 2011–2013. The GAO 2010 report lists projected quantity at 33,853 [13] (the 2012 report suggests a decrease of 39.5% [14]).
[4] Earlier procurement called for 2,507 items (a 14.8% increase). RDT&E costs for the ER version (JASSM-ER) may be lower than usual as JASSM-ER shared greater than 70% commonality of parts with JASSM, and much of the RDT&E costs could have occurred under that program.
Table 3: Estimated RDT&E Costs for Major Weapon Systems Integrated Onto Land and Ship Platforms [8–17]
| Weapon System | Integration Platform(s) | Weapon Qty |
RDT&E to Date ($M) |
Est RDT&E to Complete ($M) |
Est RDT&E Total ($M) |
Est RDT&E Total (FY15 $M) |
Est RDT&E per Item (FY15 $K) |
As of Date |
| Extended Range Munition (ERM) | Modified Naval 5-inch gun | 15,100 | 500.1 | 108.6 | 500.1 | 549.9 | 36.4 | Aug 07 |
| Intelligent Munitions System-Scorpion[1] | Land-based system | 2,624 | 487.3 | 78.7 | 566.0 | 595.7 | 227.0 | Nov 10 |
| Standard Missile-6 (SM-6) | Aegis ships | 1,200 | 996.5 | 0.0 | 996.5 | 1,017.1 | 847.6 | Aug 12 |
| Excalibur Precision 155mm Projectiles (Excalibur)[2] | Land/vehicle-based systems | 7,474 | 1,143.7 | 0.0 | 1,143.7 | 1,143.7 | 153.0 | Aug 14 |
[1] Scorpion includes an integrated system of lethal and nonlethal munitions, sensors, software, and communications equipment.
[2] Earlier procurement called for 76,677 items (a 90.3% decrease); there are multiple increments (Ia-1, Ia-2, Ib, Ib-S, Ib-N5, II, and III).
Table 4: Estimated RDT&E Costs for Major BMDS Weapon Systems [8–17]
| Weapon System | Integration Platform(s) | Weapon Qty |
RDT&E to Date ($M) |
Est RDT&E to Complete ($M) |
Est RDT&E Total ($M) |
Est RDT&E Total (FY15 $M) |
Est RDT&E per Item (FY15 $K) |
As of Date |
| BMDS: Kinetic Energy Interceptors (KEI)[1] | Fixed installation and vehicle platforms. | NA | 4,118.9 | 4,212.0 | 8,330.9 | 8,998.2 | — | Sep 08 |
| BMDS: Multiple Kill Vehicle (MKV)[2] | Fixed installation and vehicle platforms. | NA | 3,216.1 | 3,269.1 | 6,485.2 | 7,004.7 | — | Nov 08 |
| BMDS: Aegis Ballistic Missile Defense Standard Missile-3 Block IIA[3] | Fixed installation and vehicle platforms. | NA | 2,521.8 | TBD | — | — | — | May 11 |
| BMDS: Ground-Based Midcourse Defense (GMD)[4] | Fixed installation and vehicle platforms. | 370 | 40,694.5 | 4,431.9 | 45,126.4 | 46,060.3 | 12,4487.2 | Aug 12 |
| BMDS: Aegis Ballistic Missile Defense Standard Missile-3 (SM-3) Block IB[5] | Fixed installation and vehicle platforms. | 367 | 944.7 | 112.6 | 1,057.3 | 1,079.2 | 2,940.5 | Jan 13 |
| BMDS: Terminal High-Altitude Area Defense (THAAD)[6] | Fixed installation and vehicle platforms. | NA | 16,146.2 | 1,450.3 | 17,596.5 | 17,960.7 | — | Mar 13 |
[1] The program was restructured in 2007 and now only includes development of the booster components of the system, so it is unknown if previous RDT&E costs were included.
[2] A modular payload for midcourse defense system interceptors including the ground-based and KEI.
[3] The 2009 GAO report stated that RDT&E costs were $11,457M to date with an estimate of $5,093M remaining for a total of $16,550M [11].
[4] The weapon system GMD includes an interceptor with three-stage booster, Capability Enhancement II (CE-II) configuration of the Exoatmospheric Kill Vehicle (EKV), and a fire control system.
[5] The weapon system includes a radar, battle management, and command and control systems, and SM-3 missiles.
[6] The THAAD battery includes interceptors, launchers, X-band radar, a fire control radar/system, C2, and other equipment.
If it is assumed that the U.S. weapon system RDT&E costs given in Table 2 [8–17] bear a similar, direct relationship to complexity as that shown in the UK MOD CER model, and the differences in relative complexity from one system to the other are ignored (the relative complexity between each system is set to an equal value), a plot of the total RDT&E costs from lowest to highest values can be generated (Figure 6). In addition, the costs backwards and forwards can be extrapolated using a best-fitted curve (an exponential in this case). Although these assumptions are a gross oversimplification with many unknowns, the graph can still be useful by allowing a plot of a proposed weapon system to be drawn along the line in terms of its assessed relative complexity to the other weapon systems to get a rough order-of-magnitude (ROM) estimate of expected RDT&E costs.
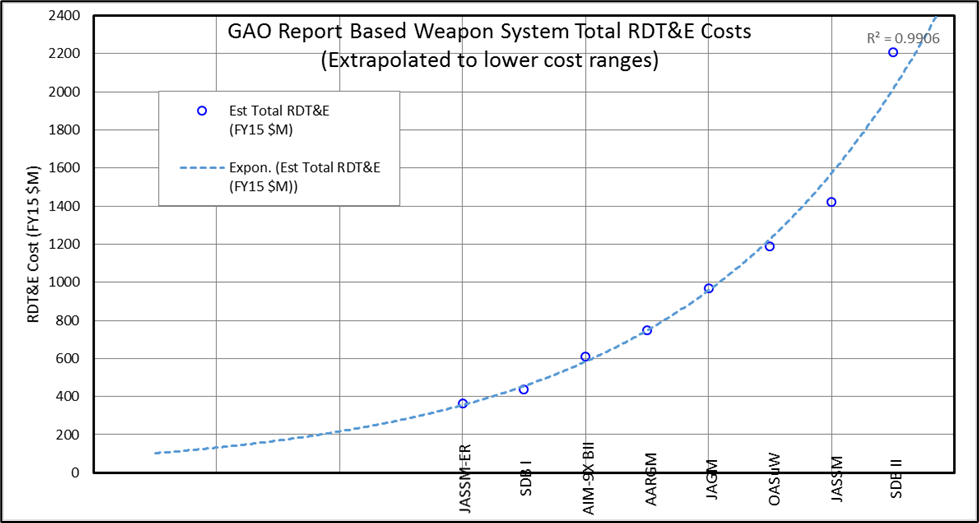
Figure 6: Notional Extrapolation for Estimated Total RDT&E Costs for U.S. Weapon Systems Integrated Onto Aircraft Platforms [1–17].
Similarly, data from the UK MOD CER model (including the lower and upper uncertainty bounds) can be converted to FY2015 U.S. dollars using 2007 exchange rates (see the Appendix) and extrapolated “up” to the ranges covered by the U.S. weapon system estimated total FY2015 RDT&E costs in Table 2 using fitted exponential curves (Figure 7) [19].
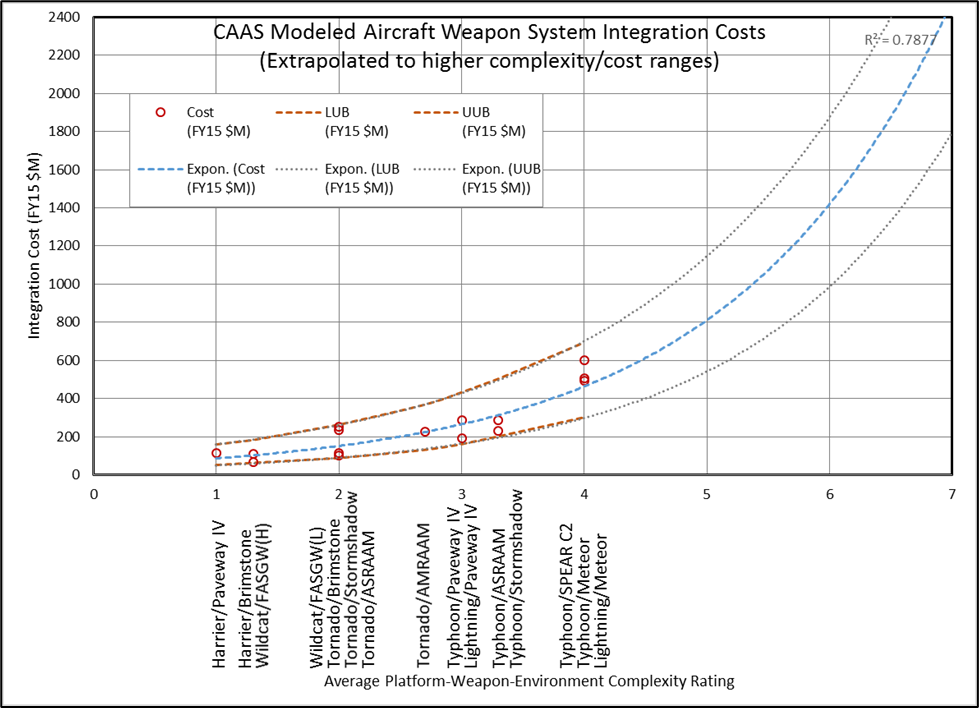
LUB= Lower uncertainty bounds; UUB=Upper uncertainty bounds
Figure 7: Notional Extrapolation of UK MOD CER Modeled Integration Costs and Uncertainty Bounds to Higher Complexity Levels [19].
Again, with some understanding of the relative complexity of a proposed weapon system, integration platform, and environment in relation to those used in the UK MOD CER model [19], it is possible to get a quick ROM estimate for expected platform-specific weapon system integration costs.
References
[1] Office of the Under Secretary of Defense (Comptroller) (OUSD[C])/ Chief Financial Officer (CFO). “Program Acquisition Cost by Weapon System.” Department of Defense (DoD) Fiscal Year 2010 Budget Request Summary Justification, https://comptroller.defense.gov/Portals/45/Documents/defbudget/fy2010/FY2010_Weapons.pdf, May 2009.
[2] OUSD(C)/CFO. “Program Acquisition Cost by Weapon System.” DoD Fiscal Year 2011 Budget Request, https://comptroller.defense.gov/Portals/45/Documents/defbudget/fy2011/FY2011_Weapons.pdf, February 2010.
[3] OUSD(C)/CFO. “Program Acquisition Cost by Weapon System.” DoD Fiscal Year 2012 Budget Request, https://comptroller.defense.gov/Portals/45/Documents/defbudget/fy2012/FY2012_Weapons.pdf, February 2011.
[4] OUSD(C)/CFO. “Program Acquisition Cost by Weapon System.” DoD Fiscal Year 2013 Budget Request, https://comptroller.defense.gov/Portals/45/Documents/defbudget/fy2013/FY2013_Weapons.pdf, February 2012.
[5] OUSD(C)/CFO. “Program Acquisition Cost by Weapon System.” DoD Fiscal Year 2014 Budget Request, https://comptroller.defense.gov/Portals/45/Documents/defbudget/fy2014/FY2014_Weapons.pdf, April 2013.
[6] OUSD(C)/CFO. “Program Acquisition Cost by Weapon System.” DoD Fiscal Year 2015 Budget Request, https://comptroller.defense.gov/Portals/45/Documents/defbudget/fy2015/fy2015_Weapons.pdf, March 2014.
[7] OUSD(C)/CFO. “Program Acquisition Cost by Weapon System.” DoD Fiscal Year 2016 Budget Request, https://comptroller.defense.gov/Portals/45/Documents/defbudget/fy2016/FY2016_Weapons.pdf, February 2015.
[8] U.S. Government Accountability Office (GAO). “Defense Acquisitions: Assessments of Selected Weapon Programs.” GAO-06-391, Report to Congressional Committees, https://www.gao.gov/new.items/d06391.pdf, March 2006.
[9] GAO. “Defense Acquisitions: Assessments of Selected Weapon Programs.” GAO-07-406SP, Report to Congressional Committees, https://www.gao.gov/new.items/d07406sp.pdf, March 2007.
[10] GAO. “Defense Acquisitions: Assessments of Selected Weapon Programs.” GAO-08-467SP, Report to Congressional Committees, https://www.gao.gov/new.items/d08467sp.pdf, March 2008.
[11] GAO. “Defense Acquisitions: Assessments of Selected Weapon Programs.” GAO-09-326SP, Report to Congressional Committees, https://www.gao.gov/assets/290/287947.pdf, March 2009.
[12] GAO. “Defense Acquisitions: Assessments of Selected Weapon Programs.” GAO-10-388SP, Report to Congressional Committees, https://www.gao.gov/new.items/d10388sp.pdf, March 2010.
[13] GAO. “Defense Acquisitions: Assessments of Selected Weapon Programs.” GAO-11-233SP, Report to Congressional Committees, https://www.gao.gov/new.items/d11233sp.pdf, March 2011.
[14] GAO. “Defense Acquisitions: Assessments of Selected Weapon Programs.” GAO-12- 400SP, Report to Congressional Committees, https://www.gao.gov/assets/590/589695.pdf, March 2012.
[15] GAO. “Defense Acquisitions: Assessments of Selected Weapon Programs.” GAO-13-294SP, Report to Congressional Committees, https://www.gao.gov/assets/660/653379.pdf, March 2013.
[16] GAO. “Defense Acquisitions: Assessments of Selected Weapon Programs.” GAO-14-340SP, Report to Congressional Committees, https://www.gao.gov/assets/670/662184.pdf, March 2014.
[17] GAO. “Defense Acquisitions: Assessments of Selected Weapon Programs.” GAO-15-342SP, Report to Congressional Committees, https://www.gao.gov/assets/670/668986.pdf, March 2015.
[18] OUSD(C) “DoD Budget Request.” https://comptroller.defense.gov/Budget-Materials/, accessed March 2016.
[19] Brown, D., and M. McNally. “Weapons Integration Cost Modelling Presentation to SCAF.” Ministry of Defence, Defence Equipment and Support (DE&S) Cost Analysis and Assurance Service, http://www.scaf.org.uk/library/prespaper/2013_02/Estimating%20the%20costs%20of%20Integrating%20Complex%20Weapons%20onto%20Air%20Platforms%20-%20Don%20Brown,%20Cost%20Assurance%20and%20Analysis%20Service,%20Defence%20Equipment%20&%20Support.pdf, accessed March 2016.
[20] Fox, B., M. Boito, J. C. Graser, and O. Younossi. “Test and Evaluation Trends and Costs for Aircraft and Guided Weapons.” RAND Corporation, https://www.rand.org/content/dam/rand/pubs/monographs/2004/RAND_MG109.pdf, 2004.
[21] GAO. “Defense Acquisitions: Better Approach Needed to Account for Number, Cost, and Performance of Non-Major Programs.” GAO-15-188, Report to the Committee on Armed Services, House of Representatives, https://www.gao.gov/assets/670/668783.pdf, March 2015.
[22] United States Department of Labor. “Databases, Tables & Calculators by Subject.” Bureau of Labor Statistics, https://data.bls.gov/pdq/SurveyOutputServlet, accessed January 2016.
[23] X-Rates. “X-Rates Historic Lookup.” http://www.x-rates.com, accessed March 2016.
APPENDIX: Inflation and Currency Conversion Data
Inflation used to determine research, development, test, and evaluation (RDT&E) costs in fiscal year (FY)2015 dollars was calculated based on the year-over-year percentage change in average U.S. Consumer Price Index (CPI) [1] and is shown in Table A-1.
The conversion of the United Kingdom Ministry of Defence (UK MOD) cost-estimating relationship (CER) model data from 2007 UK Pounds (£) to 2015 U.S. Dollars ($) was calculated based on the average exchange rate data [2] for 2007, as shown in Table A-1, and then escalated using the inflation rate data from Table A-2.
Table A-1: U.S. Yearly CPI and Inflation Data [22]
| Year | CPI | Inflation (%) |
| 2005 | 195.300 | |
| 2006 | 201.600 | 3.226% |
| 2007 | 207.300 | 2.827% |
| 2008 | 215.303 | 3.861% |
| 2009 | 219.179 | 1.800% |
| 2010 | 218.056 | -0.512% |
| 2011 | 224.939 | 3.157% |
| 2012 | 229.594 | 2.069% |
| 2013 | 232.957 | 1.465% |
| 2014 | 236.736 | 1.622% |
| 2015 | 237.017 | 0.119% |
Table A-2: 2007 UK Pounds to U.S. Dollars Exchange Rate [23]
| Month | Exchange Rate |
| Jan | 1.957960 |
| Feb | 1.957967 |
| Mar | 1.947389 |
| Apr | 1.987469 |
| May | 1.983899 |
| Jun | 1.985594 |
| Jul | 2.032933 |
| Aug | 2.011641 |
| Sep | 2.019515 |
| Oct | 2.044439 |
| Nov | 2.069963 |
| Dec | 2.014625 |
| Average | 2.001116 |
Want to find out more about this topic?
Request a FREE Technical Inquiry!