an email newsletter released every month highlighting the latest articles, events, technical inquires, and voices from the community
Spring 2015: Volume 2 Number 2

Spring 2015: Volume 2 Number 2
Published: March 1, 2015
It should come as no surprise that the electromagnetic spectrum is becoming increasingly crowded. This crowding can be largely attributed to the proliferation of new technologies that are creating an insatiable demand for bandwidth. The technologies demanding a share of the spectrum cover everything from communications to the latest directed energy weapons. Accordingly, the focus of this issue of the DSIAC Journal is to discuss some of the contemporary challenges facing practitioners engaged in a scrum for their share of the electromagnetic spectrum.
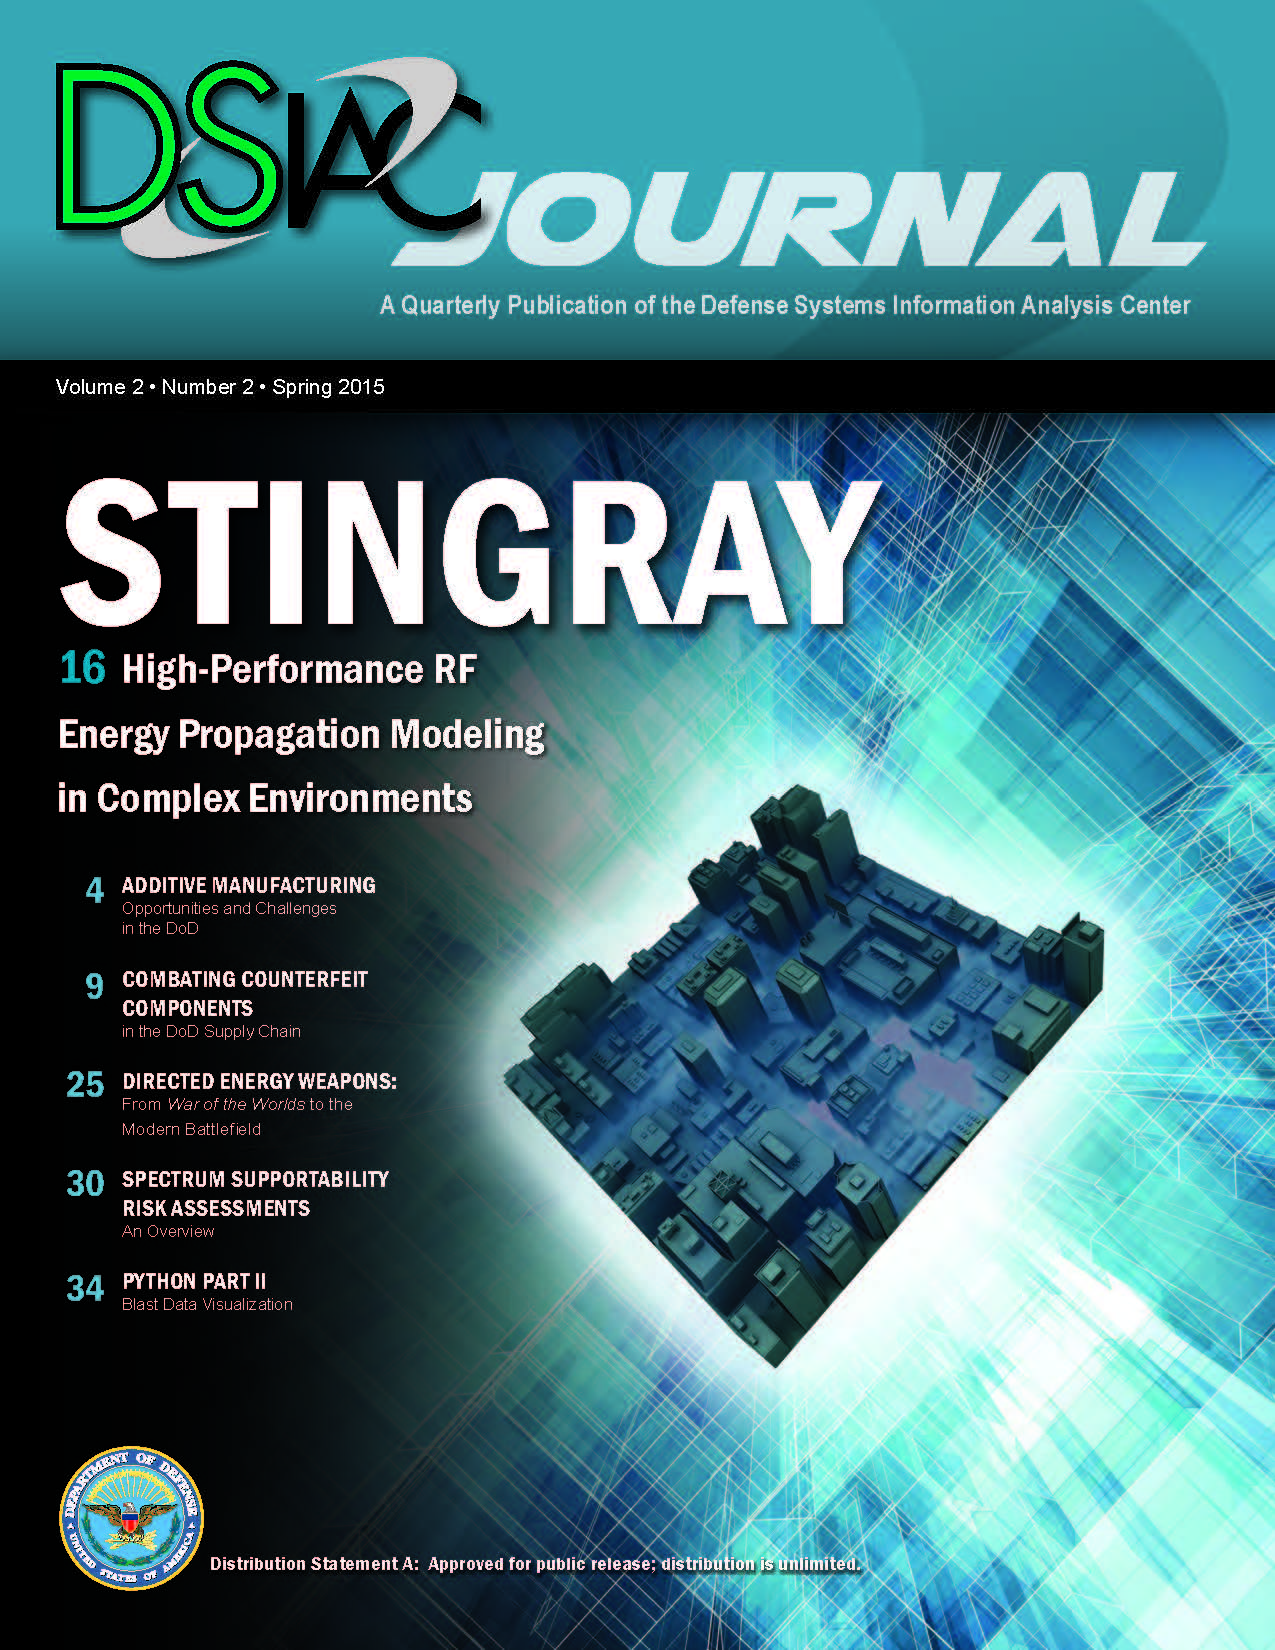
In our feature article, Christiaan Gribble and Jefferson Amstutz discuss the development of a new tool—called Stingray—that can assist in understanding the propagation of radio frequency (RF) energy in the presence of complex outdoor terrain features, (e.g., urban environments). Such understanding is critical to the military’s planning, optimizing, and analyzing of wireless communication and data networks. Simulating and visualizing RF energy propagation can be a difficult and time-consuming task, but with new tools such as Stingray, the task can become much less burdensome.
In a companion article, Brian Farmer and Martha Klein discuss how Spectrum Supportability Risk Assessments (SSRA) are becoming increasingly important and how industry practitioners should be cognizant of recent rules changes when developing new material requirements for new equipment and/or systems. In addition to the spectrum certification and the frequency assignment processes, Department of Defense (DoD) Instruction 4650.01 now requires an SSRA for the procurement of all spectrum-dependent systems, including commercial-off-the-shelf (COTS) systems.
For many of us who grew up watching science fiction shows such as Star Trek, there has been a growing fascination with electromagnetic weapons ever since the notion of such devices first appeared in early works of science fiction. Jennifer Weaver Tate provides a historical overview of electromagnetic weapons, taking us from where we first started in the world of science fiction to the contemporary electromagnetic weapons being developed and deployed today.
Additive Manufacturing (AM), often referred to as three-dimensional (3-D) printing or rapid prototyping, presents a significant opportunity for the DoD to enhance warfighter capability and reduce the current logistical footprint and total life cycle costs of numerous systems. In our Advanced Materials article, Paul Lein discusses some of the technological challenges the DoD must overcome to take full advantage of the potential of AM, and he highlights some current efforts to broaden its future adoption.
In recent years, manufacturers supplying products to the DoD have encountered a dramatic increase in the number of counterfeit components in the supply chain. In our RMQSI article, Paul Wagner discusses some of the tactics counterfeiters are employing to falsify device information, such as origin, age, content, and capability. And because the true age, specifications, and/or functions of such devices are often unknown, the effects of age and stress on the devices are also unknown, meaning the results of the product reliability models and/or testing originally used to establish product reliability may no longer be relevant.
And finally, we complete our two-part Survivability and Vulnerability series on blast visualization. Part 2 of Will Woodham’s article provides a step-bystep guide for visualizing data in 3-D and for creating simple animations. In Part 1 (in the fall 2014 edition of the DSIAC Journal), we learned how to turn simple test data into professionallooking, full-color two-dimensional (2-D) graphs using Python and Matplotlib. However, as most people would agree, animations are generally more interesting to watch than a static 2-D illustration. Thus, Part 2 discusses how to use Python and VPython to take test data visualization to the next level by creating 3-D animations from typical blast test data.

